In 1922, Alexander Friedmann took the step that Albert Einstein had not been ready to take: if one abandons the hypothesis of a static universe, the relativistic cosmological problem comprises an infinite number of solutions in which the metric varies as a function of time. Friedmann wrote:
Thus begins this founding notice of non-static cosmology. Received on June 29, 1922, by the German journal Zeitschrift für Physik, it was published shortly afterwards.
Ahead of Its Time
Friedmann’s article was ahead of its time, as one can also see from the fact that anybody studying modern cosmology can immediately recognize its main equations. While the formulations of the various metrics (de Sitter’s as well as Friedmann’s) would later change to the unified form of Howard Robertson and Arthur Walker, the differential equations that govern the time development of a space of constant positive curvature have not changed one iota.
With his 1922 article, Friedmann introduced a scientific revolution of the same magnitude as the Copernican revolution. In pre-Copernican cosmology, space was centered on a very particular place, the Earth. In pre-Friedmannian cosmology, the universe was static, in the sense of not evolving. Friedmannian cosmology introduces the historicity of the universe as space-time, as well as the idea of a beginning.
His second major cosmological article appeared in 1924. In 1925, he was appointed director of the Leningrad Geophysical Institute. In the summer of 1925, in the company of the aviator P. F. Fedosenko, he beat the altitude record in a stratospheric balloon, rising to 7,400 meters.
Friedmann died suddenly in Leningrad on September 16, 1925, from typhoid fever, at the age of thirty-seven. In 1931, he was posthumously awarded the Lenin Prize for his outstanding scientific work.
In Search of a Lost Tomb
Friedmann is buried in his hometown. An instructive anecdote is worth telling. The location of the Russian scientist’s grave was quickly forgotten, especially since the Stalinist regime that followed was hardly inclined to perpetuate the memory of this renowned “creationist” scientist. In 1988, the Alexander Friedmann Laboratory of the University of St. Petersburg (then called Leningrad State University) decided to organize the first “A. Friedmann International Seminar in Cosmology” to honor the centenary of the scientist’s birth. The director of the Friedmann Institute, my friend Andrey Grib, had the idea of a search for Friedmann’s tomb, planning a small commemorative ceremony in which admirers from various countries would participate. A venerable professor at the Institute of Physics and Technology in St. Petersburg and a former PhD student of Friedmann, Georgy Grinberg, remembered having attended the funeral of the scientist at the Smolenskoye Cemetery, and that the cosmologist’s grave was close to that of the great mathematician Leonhard Euler.
Grib therefore asked one of his students, Mihail Rosenberg, to go to the cemetery to locate the tomb — even hinting that this task would be recognized as part of his thesis work. When Rosenberg went to the cemetery and asked to consult the register of all the people buried here, the authorities replied that they had no information from prior to World War II. Rosenberg then asked to see the tomb of Leonhard Euler. After the war, he was told, Euler’s remains were transferred to another cemetery. There remained at least the old location, which the authorities indicated to him. Rosenberg explored the surroundings but found no evidence of Friedmann’s presence. He then began to quarrel with the authorities: How can the records have disappeared? At this point, an attendant approached and inquired about the dispute. The director of the cemetery replied that the student was looking for a certain “Friedmann.” “Which Friedmann,” asked the employee, “the one who discovered the non-static cosmological solution to Einstein’s equations?”
“Yes, yes,” exclaimed the student.
“Well, come with me, I’ll show you!”
This is how the cosmologist’s grave was discovered. The cemetery employee was none other than a former physicist who’d had to leave his research institute for lack of funds.
****
Jean-Pierre Luminet, a French astrophysicist specializing in black holes and cosmology, is emeritus research director at the French National Centre for Scientific Research. He is a member of the Laboratoire d’Astrophysique de Marseille (LAM) and Laboratoire Univers et Théories (LUTH) of the Paris-Meudon Observatory. Luminet has been awarded several prizes. These include the Georges Lemaître Prize (1999) for his work in cosmology, the UNESCO Kalinga Prize (2021), and the Einstein medal for the Popularization of Science (2021). He has published more than twenty science books, eight historical novels, and eight poetry collections. The asteroid 5523 Luminet was named in his honor.
The Big Bang Revolutionaries : The Untold Story of Three Scientists Who Reenchanted Cosmology
by Jean-Pierre Luminet
Many widely read scientific writers of our day mistakenly attribute the concepts of the expanding universe and the Big Bang to Edwin Hubble and Albert Einstein. Hubble did provide evidence of an expanding universe, but he neither discovered such evidence nor accepted the radical idea that space itself was expanding. As for Einstein, he held out against the idea of an expanding universe for more than a decade, and ceased working in the field as soon as he had to amend his view. The real heroes of the Big Bang revolution are the Russian Alexander Friedmann and Belgian priest Georges Lemaître. That they are virtually unknown to the general public is one thing. That their contribution is underestimated by astrophysicists and cosmologists is another, for the concepts they promulgated are among the most remarkable achievements of twentieth-century science. The Big Bang Revolutionaries amends the record, telling the remarkable story of how these two men, joined by the mischievous George Gamow and in the face of conventional scientific wisdom, offered a compelling view of a singular creation of the universe in what Lemaître termed a “primeval atom.”
Publisher : Discovery Institute Press Published : April 23, 2024 ISBN : 978-1-63712-040-8 Pages : 254 Retail Price : $18.95
Jean-Pierre Luminet, a French astrophysicist specializing in black holes and cosmology, is emeritus research director at the French National Centre for Scientific Research. He is a member of the Laboratoire d’Astrophysique de Marseille (LAM) and Laboratoire Univers et Théories (LUTH) of the Paris-Meudon Observatory. Luminet has been awarded several prizes. These include the Georges Lemaître Prize (1999) for his work in cosmology, the UNESCO Kalinga Prize (2021), and the Einstein medal for the Popularization of Science (2021). He has published more than twenty science books, eight historical novels, and eight poetry collections. The asteroid 5523 Luminet was named in his honor.
Advance Praise
This excellent and well-illustrated book convincingly puts into a clear focus the key original contributions of Friedmann and Lemaître in the early twentieth-century revolution in our understanding of the large-scale physical universe.
Roger Penrose, Emeritus Rouse Ball Professor of Mathematics at the Mathematical Institute of the University of Oxford, Emeritus Fellow of Wadham College at Oxford, fellow of the Royal Society, and recipient of the Wolf Prize (1988) and the Nobel Prize in Physics (2020)
The author brings together many aspects of thinking about the large-scale nature of our world from the points of view of concepts, theory, observation, and culture. The account starts with Albert Einstein’s thought that a philosophically satisfactory universe has no boundary, a bold conjecture that proved to fit well with Einstein’s new gravity theory and now agrees with the observational evidence. You will find fascinating details of the evolution of ideas, evidence, and the cultural situation between that time and the early steps by which George Gamow’s brilliant intuition took him to the realization that an even better picture of our universe is that it expanded from a hot dense state.
Jim Peebles, the Albert Einstein Professor in Science, emeritus, Princeton University, and recipient of the 2019 Nobel Prize in Physics
It is rare to find an internationally distinguished astrophysicist who is also a searching and meticulous historian. It is rarer still to find such a person who is also a gifted prose stylist. Jean-Pierre Luminet is such a man. The Big Bang Revolutionaries is invaluable reading for anyone fascinated by the history of the big ideas that have shaped and reshaped Western science and civilization, and for anyone who wants a front row seat to witness the all-too-common character of scientific revolution—messy, full of unexpected twists and turns, and not without its casualties. In the present case and as Luminet dramatically shows, the revolution occurred in the face of sustained prejudice from some of the finest minds in physics and astronomy. As for the wider implications of the Big Bang revolution, Luminet leaves those for the reader to contemplate.
Stephen C. Meyer, Director of the Center for Science and Culture and author of Signature in the Cell, named a Book of the Year by the Times (of London) Literary Supplement, Return of the God Hypothesis, and the New York Times bestseller Darwin’s Doubt
The twentieth century represents an exceptional period in the study of the cosmos. But this century will be remembered above all as the one in which physics, for the first time, made it possible to study the universe and its evolution. Jean-Pierre Luminet, an eminent cosmologist, takes the role of historian in this analysis of the emergence of ideas, and pays tribute to the physicists who contributed to this dizzying scientific adventure.
Michael Mayor, Swiss astrophysicist and professor emeritus at the University of Geneva; a recipient of the Viktor Ambartsumian International Prize (2010), the Kyoto Prize (2015), and the Nobel Prize in Physics (2019)
An inspiring overview of the history and physics of our modern view of the universe by the brilliant scientist Jean-Pierre Luminet, who was first to simulate black hole silhouettes. The reader is introduced to the scientific insights that revolutionized the perception of our cosmic roots and future. A fascinating read!
Abraham (Avi) Loeb, Frank B. Baird Jr. Professor of Science and Director of the Institute for Theory & Computation, Harvard University, and director for the Breakthrough Initiatives of the Breakthrough Prize Foundation
This book is a very careful discussion of the work of three less-known key figures who laid the foundations of modern cosmology—Alexander Friedmann, Georges Lemaître, and George Gamow. It does a great service in detailing the contributions that each of them made to the topic. I particularly appreciate the discussion of the pioneering work and personality of Lemaître, who can justly be called the father of scientific cosmology. With its discussion also of cosmic topology, the book is a unique contribution to the history of cosmology.
George Ellis, emeritus distinguished professor, University of Cape Town, co-author with Stephen Hawking of The Large Scale Structure of Space-Time, former president of the International Society on General Relativity and Gravitation, fellow of the Royal Society, recipient of the Templeton Prize and the Georges Lemaître International Prize
The Big Bang Revolutionaries is one terrific book. And one, I might add, of historical importance inasmuch as it restores to their rightful place two fascinating figures whom the standard history of physics in the twentieth century has shamefully neglected. Lucid? Of course it is lucid. Luminet is a fine astrophysicist. Moving? Very much so, not only for what it says about Friedmann and Lemaître, but for what it reveals about the author’s sensitive intelligence on encountering the story of men whose position of prominence was denied them. It is, all in all, a splendid restoration—something very French, I might add, in that it describes men who should have been monarchs reacquiring their thrones.
David Berlinski, Senior Fellow of the Center for Science and Culture, and author of A Tour of the Calculus, The Advent of the Algorithm, Newton’s Gift, The Devil’s Delusion: Atheism and Its Scientific Pretensions, and Science After Babel
Finally a book that brings the credit of the great cosmological revolution of the twentieth century to where it is properly due: the Russian Alexander Friedmann and the Belgian priest Georges Lemaître.
Carlo Rovelli, founder of the quantum gravity group of the Centre de Physique Théorique (CPT), Aix-Marseille University, and author of the bestselling Seven Brief Lessons on Physics
Big Bang theory has become a popular topic, but who knows the scientists who first proposed the outrageous concept that our entire universe started as an ultra-dense fireball? Theoretical physicist Jean-Pierre Luminet, well-known for his pioneering work on the visualization of black holes, takes the reader through a pedagogical, and historically accurate, tour of the conceptual vistas opened by the inventors of Big Bang theory, namely: the Russian mathematician (and meteorologist) Alexander Friedmann, the Belgian cosmologist (and priest) Georges Lemaître, and, last but not least, the eclectic genius physicist George Gamow. A must-read for any person eager to understand one of the major scientific breakthroughs of twentieth-century physics.
Thibault Damour, Institut des Hautes Études Scientifiques, recipient of the Einstein medal, the Galileo Galilei medal, and the Balzan prize
After five years of calculations and analysis, the international collaboration of the Event Horizon Telescope (EHT) delivered on May 12, 2022 the image of Sagittarius A* (Sgr A*), the giant black hole lurking at the center of our galaxy (the Milky Way), 27 000 light-years from Earth. Until now, its presence was only indirectly perceived, from a few radio emissions and the observation of the trajectories of stars orbiting at high speed around a gigantic but invisible mass. After the one obtained by the EHT in 2019 of the gigantic black hole M87* at the heart of the distant elliptical galaxy M87, this is the second direct image of this type of object that we have to date.
Remember. The very first telescopic image of a black hole surrounded by a disk of hot gas had been unveiled in April 2019 by the same EHT teams: it was the black hole M87* located at the center of the giant elliptical galaxy M87, 50 million light-years away. The observations of Sgr A* had been made in April 2017, during the same campaign as those of M87*. If it took five years of analysis for Sgr A* against two for M87*, it is because during the exposure time of the observations – of the order of an hour –, the light emission of the gas disk around Sgr A* is very variable, whereas that around M87* is almost fixed. The reason is that Sgr A* has a mass 1500 times smaller than M87* (4 million solar masses for SgrA* against 6 billion for M87*), so that the characteristic time scale of the luminous variability, given by the simple formula GM/c^3, is much faster: 20 seconds, against several hours for M87*.
Figure 2. The montage illustrates the huge size difference between M87* and SgrA*, relative to the size of our solar system.Figure 3: Due to its giant size, the light structure around M87* varied very little during the 4 days of observations in April 2017.
Attempting to capture a sharp image of SgrA* in an exposure time of one hour was therefore like taking a picture of a dog running after its tail. It took considerable integration work to reconstruct a sufficiently sharp “average” image of SgrA*, as Figure 4 clearly shows.
Figures 4a-b. On the left, several tens of shots of SgrA* show its large temporal variability, to the point that the reconstruction of an averaged image cannot accurately reproduce the state of the accretion stream (uncertain position of the overbrightness). On the right on the other hand, for M87*, due to its giant size, the light structure around it has varied very little during the 4 days of observations performed in April 2017, so that the averaged image reflects the actual state of the accretion stream quite accurately.
To achieve the angular resolution needed to image SgrA* and M87*, equivalent to the tiny angle at which we would see an apple on the Moon from Earth, the EHT used a network of radiotelescopes stretching from Antarctica to North America via Chile, the Hawaiian Islands, and Europe so as to have the equivalent of a single planet-sized instrument operating in interferometric mode.
Figure 5. The eight radio telescopes of the EHT array in use in April 2017.
What is striking at first sight is that the two photographs of M87* and SgrA* look very similar: in the center, a black shadow, image of the event horizon (name given, I recall, to the intangible surface of a black hole) enlarged by a factor of 2.6 (as I had shown in my 1979 paper, cf. fig. 6), surrounded by a yellow-orange luminous corona (in false colors), blurred and with spots of highlighting.
Figure 6. Diagrams from my 1979 paper and my popularization book “Le destin de l”univers” (2006), illustrating how the “shadow” of a black hole is the magnified image of its event horizon by a factor of 2.6, due to a gravitational lensing effect. A very thin ring of light, called the photon ring, encircles it.Figure 7. The two similar telescopic images of M87* and SgrA*.
The most important difference is the appearance of three distinct spotlights in the bright ring of SgrA*, whereas the ring of M87 is continuous with two contiguous highlights. Similarly, the central shadow appears less round for SgrA*, probably due to the large number of images that had to be integrated during the hours of observation.
A catalog of several thousands of numerical simulations has been established for comparison with the EHT images and to fix probable ranges of values for the physical characteristics (viewing angle, spin, etc., see below) of SgrA*. Hot ionized gas is rapidly rotating around the black hole, forming spiral arms that become brighter at their tangency with the photon ring, where the light is amplified by strong gravitational lensing. It is these bright points that are integrated in the course of time, and that give the general structure of the luminous rings.
Figure 8. Thousands of numerical simulations by the EHT teams were required to reconstruct a clear image of SgrA*.
Accretion disk or photon ring?
What exactly do these two historical pictures reveal?
Figure 9. First numerical simulation of a black hole surrounded by an accretion disk, published in January 1979, with captions added. The shadow of the black hole is in the center. The “top image” is the direct (so-called) primary image of the accretion disk, distorted however by the gravity field. The ISCO (Inner Stable Circular Orbit) is the last stable orbit marking the inner edge of the accretion disk. The luminous ring surrounding the shadow is the superposition of the secondary, tertiary, etc. images of the accretion disk forming the the photon ring. The Doppler effect due to the motion of the gas at relativistic speed explains the strong asymmetry of the apparent luminous flux seen at great distance. The calculated luminous flux is however “bolometric”, i.e. integrated on all the wavelengths of the electromagnetic radiation.Figure 10. Numerical simulations made with Jean-Alain Marck in 1989, using my 1979 calculations but adding false colors and variable viewing angles (starting from 0° for an equatorial view to 90° for a polar one), thanks to the progress of computers at the time.
to point out the striking similarities:
Figure 11. Striking similarities at first glance between the telescopic images (top) and the numerical simulations (bottom)
and to draw quick conclusions about the structure of the accretion disk and the angle from which it is seen from the Earth:
Figure 12. A tempting interpretation at first sight…
I confess that I myself got carried away by this interpretation, which on the one hand flattered my pioneering calculations, on the other hand was in no way denied by the EHT researchers, who on the contrary rolled out a red carpet for me at the first conference held on the subject at Harvard University in June 2019.
Figure 13. My dinner talk at the Black Hole Initiative Conference held at Harvard University on May 20-22, 2019 after the release of the first telescopic image of M87*.
So much so that, as much for the image of M87* as for the more recent one of SgrA*, this interpretation has been taken up in most of the popular science media. Especially since the specialized articles published by the EHT researchers, full of technical details, remain strangely vague on the question…
However, the physical reality is always more complex than our first reading grids. A finer analysis, made since 2019 on M87* and reinforced in 2022 by that of SgrA*, suggests that the luminous “donut” shaped corona is not the direct image of the gaseous accretion disks orbiting their respective black holes, and that the spotlights do not completely reflect the real state of the gas around the black hole, nor do they translate the Doppler effect due to the relativistic rotation of the gas! Continue reading First image of the galactic black hole Sagittarius A*: an unprecedented decryption→
In September 2016 I went to the Saint-Paul-de-Mausole monastery, a masterpiece of Provençal Romanesque art built in the vicinity of the Gallo-Roman city Glanum, south of Saint-Rémy de Provence. Part of the building remains today a psychiatric institution. Van Gogh stayed there from May 8, 1889 to May 16, 1890. On the second floor, the room where he was interned has been reconstructed.
Aerial view of the Saint-Paul-de-Mausole asylum and orientation of the window of Van Gogh’s room
Through the window, facing east, we can see the landscape that Van Gogh could contemplate. Even if this landscape has been transformed for a little more than a century, one does not see the hills represented in his painting. In reality, there is the wall of the asylum’s park that encloses a field of wheat, which extends between the asylum and the wall. And there are no large cypress trees in sight, and even less the village of Saint-Rémy.
In fact the small chain of Alpilles is in direction of the South. As for the village of Saint-Rémy and its church tower, which is quite far away in the northern direction, it is just as invisible from the window. We conclude that Van Gogh did not paint the terrestrial part of his Starry Night from what he saw from his window.
He must have gone outside. But when?
My friend Philippe André, a psychiatrist and art lover who studied Van Gogh’s correspondence in depth before publishing his novel Moi, Van Gogh, artiste peintre in 2018, wrote to me that in the first days after his internment on May 8: “At night, he is locked in his room and his equipment is under lock and key in another empty room that he was kindly allocated for this purpose. Moreover, he was very distressed and only managed to paint his own works (Sunflowers, Joseph Roulin…) or to paint very similar elements that were in the park of the asylum (Iris, Lilacs…). No strength, during those first weeks, to paint deep landscapes! “
In fact, when I was finally able to consult Van Gogh’s complete correspondence, I read that on May 9, the day after his arrival, he wrote to his sister-in-law “Jo” (Theo’s wife, therefore):
« Although there are a few people here who are seriously ill, the fear, the horror that I had of madness before has already been greatly softened.
And although one continually hears shouts and terrible howls as though of the animals in a menagerie, despite this the people here know each other very well, and help each other when they suffer crises. They all come to see when I’m working in the garden, and I can assure you are more discreet and more polite to leave me in peace than, for example, the good citizens of Arles.
It’s possible that I’ll stay here for quite a long time, never have I been so tranquil as here and at the hospital in Arles to be able to paint a little at last. Very near here there are some little grey or blue mountains, with very, very green wheatfields at their foot, and pines. » [Letter 772]
From the first sentence it is clear that his anxiety was perhaps not so great, and the rest of the letter confirms that he did begin to paint, but without being able to go beyond the confines of his room or the small garden.
On May 23, he wrote to his brother Theo:
« The landscape of St-Rémy is very beautiful, and little by little I’m probably going to make trips into it. But staying here as I am, the doctor has naturally been in a better position to see what was wrong, and will, I dare hope, be more reassured that he can let me paint.
[…] Through the iron-barred window I can make out a square of wheat in an enclosure, a perspective in the manner of Van Goyen, above which in the morning I see the sun rise in its glory. With this — as there are more than 30 empty rooms — I have another room in which to work. […] So this month I have 4 no. 30 canvases and two or three drawings. » [Letter 776]
This shows that Vincent plans to be able to walk in the countryside outside the monastery very soon. The four canvases he has in progress were painted in the garden.
Between May 31 and June 6 he wrote to Theo asking him to send him canvases, colors and brushes, his Arles supply being exhausted. He adds :
« This morning I saw the countryside from my window a long time before sunrise with nothing but the morning star, which looked very big. […] When I receive the new canvas and the colours I’ll go out a bit to see the countryside. » [Letter 777]
And finally, on June 9, after he had received the canvases and colors sent by Theo, whom he thanked warmly:
« I was very glad of it, for I was pining for work a little. Also, for a few days now I’ve been going outside to work in the neighbourhood. […]I have two landscapes on the go (no. 30 canvases) of views taken in the hills. […] Many things in the landscape here often recall Ruisdael » [Letter 779]
So we have the answer: it was not until the first week of June that Vincent was able to leave the monastery and start painting the landscapes seen from the surrounding countryside. Let’s start with the hills of the Alpilles. As mentioned above, they are invisible from his room, so they were necessarily painted outside. We find the same profile in other paintings of the period:
Wheat Field after the Storm (detail), June 1889.
The Reaper (detail), June 1889
The profile of the hills is quite faithfully rendered, as I was able to see when I found the approximate location where Van Gogh set up his easel (today a field of vines):
In October 2017, an object from interstellar space was spotted by the Pan-STARRS 1 telescope in Hawaii: it crossed our solar system, passing relatively close to Earth (30 million kilometers away). It was the first of its kind to be detected. Named Oumuamua (“scout” in Hawaiian), it immediately aroused the interest of astronomers. Where did it come from, what as it composed of, what was its history?
Oumuamua’s trajectory, hyperbolic and strongly inclined with respect to the plane of the ecliptic, indicated that it is an interstellar object. After passing at its closest distance to the Sun in September 2017, it continued its journey towards the constellation of Pegasus.
Subsequent radio astronomical observations suggested that Oumuamua was about ten times longer than it is wide, dark red in color, dense and rich in metal. An artist’s view of it in the shape of a cigar was successfully circulating on the Internet.
A spectacular artist’s view attributing to Oumuamua a very elongated shape, which has made headlines in the media.
Specialists in “small bodies” believe that it is an asteroid or a comet expelled from its original planetary system, perhaps the remnant of a disrupted planet. But for Avi Loeb, chairman of the Department of Astrophysics at Harvard, its shape is too strange to be natural.
Abraham (Avi) Loeb, chair of the Astronomy Dept. talks about a new search for methods for primitive and intelligent life far from Earth inside the Perkins Building at Harvard University. Kris Snibbe/Harvard Staff Photographer
In a very serious article published late 2018 with one of his students, he hypothesized that Oumuamua is an interstellar probe sent to us by an advanced extraterrestrial civilization in order to deliver a message. Like the majority of my colleagues, I considered at the time the idea intelligent and daring, but far-fetched. It was irresistibly reminiscent of the scenario of Rendezvous with Rama, a science fiction novel published in 1973 by Arthur C. Clarke that all fans of the genre are familiar with.
However, Loeb has developed his thesis in a book that is enjoying a worldwide release (happy Anglo-American authors and what a formidable editorial machine!), with the simple and appealing title Extraterrestrial.
At first glance, this is the kind of sensational book that would have annoyed me. However, I know its author. Far from being one of those whimsical popularizers who occasionally make the headlines with catchy titles, Loeb is a genuine scientist who has published very serious articles on a wide range of subjects, from cosmology to black holes. I am therefore well placed to appreciate his contributions. In fact, he personally received me in June 2019 at Harvard, during the gala dinner of the conference organized to celebrate the first telescopic image of a black hole obtained two months earlier by his team, and which confirmed my calculations made 40 years earlier (hence the invitation).
Plenary lecture on black hole imaging that I gave on May 23, 2019 at the Black Hole Initiative conference at Harvard University, organized by the Event Horizon Telescope Consortium. Avi Loeb hands me the microphone after his speech presenting my work.
Loeb is a particularly imaginative mind. With this book for a general audience, he also proves to be an excellent writer, taking care of the scientific background as well as the literary style. One can judge it by this simple sentence: “a photo-sail swept away by the gust of a supernova makes me think of the fluffy pappus of a dandelion seed, blown by the wind towards virgin soil to be fertilized”.
From the introduction, he reminds us that one of the fundamental questions of humanity, undoubtedly the one that challenges us the most through the prism of science, philosophy and religion, is: are we alone in the universe? And, more specifically, are there other conscious civilizations exploring interstellar space and leaving testimonies of their undertakings?
The question certainly fascinates the general public. Just look at the success of the French UFO series currently on Canal Plus channel, of which was the scientific advisor – proof that I take the question of extraterrestrial intelligencies seriously, even if I am far from being as convinced as my American colleague.
The public, which generally has an agreed idea of scientists right in their boots, is probably unaware that many astrophysicists would dream of convincing proof of the existence of advanced civilizations. But for the moment, it must be admitted that there is none. Being a scientist also means knowing how to deal with the disappointment of “natural explanations”. Continue reading Oumuamua : extraterrestial spaceship or extrasolar asteroid?→
We left Vincent Van Gogh in September 1888, after he painted his Starry Night over the Rhône in Arles. On October 23rd, Paul Gauguin joined him in the “Yellow House” which he rented and where he stayed for two months. The cohabitation between these two geniuses of painting is not easy. Apart from quarrels of a domestic nature, things went badly wrong on 23 December 1888, after a discussion on painting during which Gauguin argued that one should work with imagination, and Van Gogh with nature. According to the classical thesis, Vincent threatens Paul with a knife; the latter, frightened, leaves the scene. Finding himself alone in a fit of madness, Vincent cuts off a piece of his left ear with a razor, wraps it in newspaper and offers it to an employee of the neighbouring brothel. Then he goes to bed. The police doesn’t find him until the next day, his head bloody and confused. Gauguin explains the facts to them and leaves Arles. He will never see his friend again.
The Yellow House (“The Street”), 1888, oil on canvas, oil on canvas, 72 cm x 91.5 cm. Credits : Van Gogh Museum, Amsterdam (Vincent van Gogh Foundation)
The day after his crisis, Van Gogh was admitted to hospital. A petition signed by thirty people demanded his internment in asylum or expulsion from the city. In March 1889, he was automatically interned in Arles hospital by order of the mayor while continuing to paint, and on 8 May he left Arles, having decided to undergo psychiatric treatment in the insane asylum at Saint-Paul-de-Mausole, a little south of Saint-Rémy-de-Provence. He stayed there for a year (until May 1890), subject to three bouts of dementia, but between which his pictorial production was extraordinarily rich: he produced 143 oil paintings and more than 100 drawings in the space of 53 weeks.
One of the key works of this period is the Starry Night, now in the Museum of Modern Art in New York.
I have always been fascinated by this nocturnal painting, with its tormented sky in the background, composed of volutes, whirlpools, huge stars and a crescent moon surrounded by a halo of light. In the background, a village with a church steeple overstretched towards the sky, which at first glance is thought to be the village of Saint-Rémy-de-Provence. Due to the position of the moon, the orientation of its crescent horns and the streak of whitish mist over the hills, one does not need to be a great expert to see at first glance that the Starry Night represents a sky just before dawn. Can we go further?
In 1995, while snooping around in a bookshop in Paris, I stumbled upon a booklet entitled La Nuit étoilée: l’histoire de la matière et la matière de l’histoire. It was the French translation of an article booklet published in 1984 in the United States by Albert Boime (1933-2008), professor of art history at the University of California at Los Angeles (“Van Gogh’s Starry Night: A History of Matter and a Matter of History, Arts Magazine, December 1984).
The book is fascinating. The author raises many questions which he tries to answer, notably concerning the date of the painting’s execution and the nature of the astronomical objects represented.
I said in previous posts that Van Gogh painted from nature, and therefore intended to reproduce the night skies as he saw them at the precise moment he began his paintings. I have shown how his Café le soir (Café Terrace at night ) and his Nuit étoilée au-dessus du Rhône (Starry Night over the Rhône), painted in Arles, showed the striking realism he displayed in his pictorial transposition of the firmament. This realism is less obvious in the Starry Night of Saint-Rémy, with its immense sky full of luminous objects, this moon and these far too big stars scattered among vast swirling volutes. Could his representations of the sky have slipped from realism to the wildest imagination, or even to delirium in front of the easel, to the rhythm of his own psychic deterioration?
To answer this question, we must investigate the precise genesis of the work. If, thanks to an astronomical reconstruction, we find a sky identical or close to the one represented in the painting – as was the case with his Arlesian nocturnal works – then we will have proved the realism of the painting, in addition to having dated the sketch to the day and hour.
As we have seen in the previous post The Starry Nights of Vincent Van Gogh’s (1): Café Terrace at night, in Arles, Vincent has therefore been living in the old city of Arles since February 1888. In mid-September, after writing to his sister Wilhelmina (or Willemien according to the scripts) that he wanted “now absolutely to paint a starry sky“, he takes action in his Café Terrace, where he shows a small piece of sky dotted with a few stars of the constellation Aquarius.
A much wider sky is represented in The starry night over the Rhône, painted shortly after, at the end of September. This 72.5 cm x 92 cm canvas, now on display at the Musée d’Orsay in Paris, shows in the foreground, on the bank, a couple seen from the front and moored boats. The silhouettes of roofs and bell towers stand out against the blue of the sky, the city lights reflecting on the river. Among the many stars we recognize in the center the seven stars of the Big Dipper in the constellation Ursa Major, which illuminate a sky in shades of blue. As we will see, the canvas raises more questions than the Café Terrace, due to the incompatibility between the terrestrial view and the celestial view. A detailed survey was conducted in 2012 by photographer Raymond Martinez, see https://raymoonphoto.com/fr/lenigme-du-tableau-2/ (in French) – whose main elements I am adding here with some personal additions.
The date of execution is confirmed by a letter addressed to his brother Théo on September 29th, when he has just finished the painting of which he attaches a sketch: ”Included herewith little croquis of a square no. 30 canvas — the starry sky at last, actually painted at night, under a gas-lamp. The sky is green-blue, the water is royal blue, the areas of land are mauve. The town is blue and violet. The gaslight is yellow, and its reflections are red gold and go right down to green bronze. Against the green-blue field of the sky the Great Bear has a green and pink sparkle whose discreet paleness contrasts with the harsh gold of the gaslight. Two small coloured figures of lovers in the foreground.”
Sketch of The Starry Night on the Rhone attached to the letter of September 29th to Théo Van Gogh.
On October 2nd, 1888 he sent a slightly different sketch to his painter friend Eugène Boch, with this description: ” And lastly, a study of the Rhône, of the town under gaslight and reflected in the blue river. With the starry sky above — with the Great Bear — with a pink and green sparkle on the cobalt blue field of the night sky, while the light of the town and its harsh reflections are of a red gold and a green tinged with bronze. Painted at night. »
Extract from the letter of October 2nd to Eugène Boch, where Vincent describes his Starry Night
Second sketch attached to the letter of October 2nd
Now let’s look for the place where the painting was done. A sentence from the September 14th letter [Letter 678] to his sister indicates that he certainly painted it on the spot: “Now there’s a painting of night without black. With nothing but beautiful blue, violet and green, and in these surroundings the lighted square is coloured pale sulphur, lemon green. I enormously enjoy painting on the spot at night. In the past they used to draw, and paint the picture from the drawing in the daytime. But I find that it suits me to paint the thing straightaway. It’s quite true that I may take a blue for a green in the dark, a blue lilac for a pink lilac, since you can’t make out the nature of the tone clearly. But it’s the only way of getting away from the conventional black night with a poor, pallid and whitish light, while in fact a mere candle by itself gives us the richest yellows and oranges.“
By comparing the current landscape (day and night) with that of the painting, we can spot the exact positioning of the bell towers of the churches of Saint-Julien and Saint-Martin-du-Méjan, the curve of the Rhône on the surface of which, at night, are still reflected the lights of street lamps (now electric, no more gas!), and in the center, the Pont de Trinquetaille:
“In which space do our dreams live? What is the dynamism of our nightlife? Is the space of our sleep really a rest area? Is it not rather an incessant and confused movement? On all these problems we have little light because we do not find, when the day comes, only fragments of night life. “
In these texts written from 1942 to 1962 (gathered in Le Droit de rêver, PUF, collection “Quadrige”, 2010), Gaston Bachelard celebrates the difficult synthesis of imagination and reflection that seems to him to guarantee, for writers as for artists such as Baudelaire and Van Gogh’s, fidelity to dreamlike values. “A Van Gogh’s yellow is like an alchemical gold, a gold butine like a solar honey. It is never simply the gold of the wheat, the flame, or the straw chair; it is a gold forever individualized by the endless dreams of genius. It no longer belongs to the world, but it is the good of a man, the heart of a man, the elementary truth found in the contemplation of a lifetime. “
Coucher de soleil sur champ de blé près d’Arles (Sunset on wheatfield near Arles), 1888
In the series of notes that I begin here, I will analyze in detail the extraordinary reports that Vincent Van Gogh (1853-1889) maintained with the vision of the Provençal sky.
On February 20, 1888, aged 35, Vincent, the man from dark-heavened Northern Europe, moved to the old city of Arles, in the South of France. Although he arrived in the city by a snowy day, he discovered the Provençal light, brighting day and night. Stunned by the transparency of the firmament, he writes to his brother Theo: “The deep blue sky was spotted with clouds deeper blue than the fundamental blue of an intense cobalt, and others of a blue clearer, like the blue whiteness of the milky ways. In the background, the stars sparkled, clear, green, yellow, white, lighter pink, diamond-like diamonds. ” From then sprout in him the crazy project of painting the sky.
Van_Gogh : Self portrait as an artist, Arles1888
On April 12, he wrote to his friend the painter Émile Bernard: “A starry sky, for example, well — it’s a thing that I’d like to try to do, just as in the daytime I’ll try to paint a green meadow studded with dandelions“. He hesitates however and procrastinates, intimidated by the subject. On June 19, he expressed his hesitation to Émile Bernard: “But when will I do the starry sky, then, that painting that’s always on my mind? Alas, alas, […] the most beautiful paintings are those one dreams of while smoking a pipe in one’s bed, but which one doesn’t make. But it’s a matter of attacking them nevertheless, however incompetent one may feel vis-à-vis the ineffable perfections of nature’s glorious splendours. “
On 9th (or 10th) of July 1888 he confesses to Theo: “But the sight of the stars always makes me dream in as simple a way as the black spots on the map, representing towns and villages, make me dream“.
From word to deed takes place between 9 and 14 September. In fact, he begins on the 9th a long letter addressed to his sister Willemien: “I definitely want to paint a starry sky now. It often seems to me that the night is even more richly coloured than the day, coloured in the most intense violets, blues and greens. If you look carefully you’ll see that some stars are lemony, others have a pink, green, forget-me-not blue glow. And without labouring the point, it’s clear that to paint a starry sky it’s not nearly enough to put white spots on blue-black.“
From left to right, self-portrait of Emile Bernard, friend of Vincent, photographic portraits of his brother Theo and his sister Willemien.
He did not post it and resumed his letter on the 14th. In the meantime he painted his first starry night, the painting is called Cafe Terrace at night (currently at the Kröller-Muller Museum in Otterlo, the Netherlands):
“I started this letter several days ago, up to here, and I’m picking it up again now. I was interrupted precisely by the work that a new painting of the outside of a café in the evening has been giving me these past few days. On the terrace, there are little figures of people drinking. A huge yellow lantern lights the terrace, the façade, the pavement, and even projects light over the cobblestones of the street, which takes on a violet-pink tinge. The gables of the houses on a street that leads away under the blue sky studded with stars are dark blue or violet, with a green tree. Now there’s a painting of night without black. With nothing but beautiful blue, violet and green, and in these surroundings the lighted square is coloured pale sulphur, lemon green. I enormously enjoy painting on the spot at night“.
Terrasse de café le soir
And on September 16th, he describes his painting to Theo more briefly: “The second [painting of this week] shows the outside of a café, lit on the terrace outside by a large gas-lamp in the blue night, with a patch of starry blue sky.represents the outside of a cafe illuminated on the terrace by a large gas lantern in the blue night. with a corner of starry blue sky. […] The question of painting night scenes or effects, on the spot and actually at night, interests me enormously.“
We know exactly where the painting was executed: Place des hommes, now renamed Place du Forum. The map of Arles in Van Gogh’s time, shown below, shows its location, as well as other intramural sites where Vincent settled to paint La Maison jaune (The Yellow House) in September 1888), the Pont métallique de Trinquetaille (the Metallic Bridge of Trinquetaille) in October 1888) and Nuit étoilée sur le Rhône(Starry Night on the Rhone), on which I will return at length in the following post.
The café, which at that time was called the Terrace, has since been renamed Café Van Gogh. Fortunately, the historic site has not been ransacked by modern constructions as is so often the case elsewhere, and even today the walker immediately recognizes the layout of the streets and buildings painted by Vincent, day and night.
Café Van Gogh nowadays. Night photography shows the light pollution characteristic of urban lighting, violent and useless projectors erasing all traces of the firmament. A huge loss of cosmic feeling …
Now a question that arises is: are the stars he has represented on the canvas randomly arranged, or do they correspond to a real configuration of the night sky?
In the preparatory study for the painting shown below, the sky is just sketched with wiggling lines, without any star. It is quite possible that Vincent made this study during the day .
Preparatory study for the painting, September 1888. Dallas Museum of Art, The Wendy and Emery Reves Collection.
However, in view of van Gogh’s epistolary statements, everything suggests that he wanted to show a certain realism in the pictorial transposition of the firmament seen at night. Since, according to the letter that Vincent sent to his sister Willemien, we know the date of execution (between 9 and 14 September) within a few days, it is possible to check using a reconstitution software astronomical what portion of sky was represented by Vincent, seen from the Forum Square in a direction very close to the South (this is the orientation of the street).
Let’s use the excellent Stellarium software. Position us at the GPS coordinates of the Forum Square, namely 43 ° 40 ‘39.7 “N 4 ° 37’ 37.6” E, set the date from September 9, 1888 at about 10 pm, let us look south and let the map scroll to find a stellar configuration possibly close to that of the table, between 20 and 30° of declination (such is the height of the stars represented in the table).
I once read an article (which I lost references) claiming that it is the legs of the constellation Scorpio, with the stars α (the brilliant Antares), σ, β, δ and Scorpion π. The problem is that between 9 and 14 September, the constellation Scorpio is only above the horizon until 17h UT, after it passes below and can not be seen, even at the beginning of the night which in September falls well later. Also at that time the Moon was at its first crescent in the legs of Scorpio. This is not the correct identification.
Let’s now examine the map of the sky seen between 9 and 14 September 1888 around 22h in the southern extension of the Forum Square: we see the stars of the constellation Aquarius up to magnitude 5, with its characteristic configuration shaped from Y.
Stars of the Aquarius constellation visible to the naked eye between 9 and 14 September 1888 at 22h in the direction of the Cafe de la Terrasse.
I added the profile of the buildings hiding part of the field of view, traced the characteristic lines connecting the most brilliant stars, and compared with Vincent’s painting:
The identification seems pretty convincing … It also reinforces the epistolary statements in which Vincent expressed his concern to represent a real sky and not imaginary.
This will be even more spectacular in the two famous starry nights painted in Arles in 1888 and Saint-Rémy in 1889. I will analyze them in the same way in the following posts, with the key to very unexpected surprises …
Unfortunately Marck’s simulations of black hole accretion disks remained mostly ignored from the professional community, due to the fact that they were not published in peer-reviewed journals and, after their author prematurely died in May 2000, nobody could find the trace of his computer program…
Then, unaware of Marck’s results, several researchers of the 1990’s were involved in the program of calculating black hole gravitational lensing effects in various situations. Stuckey (1993) studied photon trajectories which circle a static black hole one or two times and terminate at their emission points (« boomerang photons »), producing a sequence of ring-shaped mirror images. Nemiroff (1993) described the visual distortion effects to an observer traveling around and descending to the surface of a neutron star and a black hole, discussing multiple imaging, red- and blue-shifting, the photon sphere and multiple Einstein rings. He displayed computer-generated illustrations highlighting the distortion effects on a background stellar field but no accretion disk, and made a short movie now available on the internet (Nemiroff 2018), two snapshots of which are shown in figure 1.
Figure 1. Trip to a black hole by Robert Nemiroff, 1993.
The first simulations of the shape of accretion disks around Kerr black holes were performed by Viergutz (1993). He treated slightly thick disks and produced colored contours, including the disk’s secondary image which wraps under the black hole (figure 2). The result is a colored generalization of the picture by Cunningham and Bardeen (1973) shown in 40 Years of Black Hole Imaging (1).
Figure 2. Primary and secondary images of a simple accretion disk model around a Kerr black hole, seen by a faraway observer. Colors indicate combined gravitational and Doppler shifts (from Viergutz 1993).
More elaborate views of a geometrically thin and optically thick accretion disk around a Kerr black hole were obtained by Fanton et al. (1997). They developed a new program of ray tracing in Kerr metric, and added false colors to encode the degree of spectral shift and temperature maps (figure 3). Zhang et al. (2002) used the same code to produce black-and-white images of standard thin accretion disks around black holes with different spins, viewing angles and energy bands (figure 4).
Figure 3. False color contour maps showing how the monochromatic radiation emitted by a Keplerian accretion disk would be seen at infinity for various values of the inclination angle to the plane of the disk (top to bottom : 5°, 45°, 85°). The left column refers to a non-rotating black hole, the right one to a rapidly rotating black hole with a=0.998 M. The white zones stand for the regions with zero redshift. Left-hand side of the disk is approaching the observer and blueshifted (from Fanton et al. 1997).
Figure 4. Disk images of accretion disks extending up to 20 Schwarzschild radii for different spins of Kerr black holes, viewed in different energy ranges and inclination angles (from Zhang et al. 2002).
Ben Bromley et al. (1997) calculated integrated line profiles from a geometrically thin disk about a Schwarzschild and an extreme Kerr black hole, in order to get an observational signature of the frame-dragging effect (Figure 5).
Figure 5. Image of a geometrically thin disk around an extreme Kerr (maximally rotating) black hole seen at an inclination of 75°. The inner and outer radii of the Keplerian (circularly rotating) disk are at 1.24 M and 6 M. The colors encode the apparent light frequency, the white strip divides redshifted and blueshifted regions. The asymmetric appearance of the inner disk edge results from the frame-dragging effect of black hole rotation (from Bromley et al. 1997).
In 1998 Andrew Hamilton started to develop for a student project at the University of Colorado a “Black Hole Flight Simulator”, with film clips that have been shown at planetariums, also available on the Internet. The first depictions were very schematic, but the website was constantly implemented. It now offers journeys into a Schwarzschild or a Reissner-Nordström (i.e. electrically charged) black hole with effects of gravitational lensing on a stellar background field, as well as animated visualizations of magneto-hydrodynamic simulations of a disk and jet around a non-rotating black hole (Hamilton 2018).
Journey into and through an electrically charged (non realistic) Reissner-Nordström black hole, from Andrew Hamilton, 2010
From Idea to Reality
A turning point in the history of black hole imaging came when the possibility of viewing in practice the shadow of SgrA* with VLBI radio astronomy techniques was first discussed (Falcke et al. 2000, Doeleman et al. 2001). Heino Falcke, Fulvio Melia and Eric Agol (who curiously did not quote my 1979 article) developed a general relativistic ray-tracing code that allowed them to simulate observed images of Sgr A* for various combinations of black hole spin, inclination angle, and morphology of the emission region directly surrounding the black hole (figure 6).
Figure 6. Images of an optically thin emission region surrounding the galactic black hole SgrA*. The black hole is maximally rotating (a = 0.998) in the top row and non-rotating in the bottom row. The emitting gas is assumed to be in free fall (top) or on Keplerian shells (bottom) with a viewing angle 45°. The left column shows the ray-tracing calculations in general relativity, the other columns are the images seen by an idealized VLBI array at 0.6 mm and 1.3 mm wavelengths, taking account of the interstellar scattering (from Falcke et al. 2000).
In 2001, Ben Bromley, Fulvio Melia and Siming Liu provided maps of the polarized emission of a Keplerian disk to illustrate how the images of polarized intensity from the vicinity of SgrA* would appear in future VLBI observations (Figure 7).
Figure 7. Polarization maps at three wavelengths (1.5 mm, 1 mm, 0.67 mm from top row to bottom row) calculated for the galactic black hole candidate SgrA*. The left most column shows how the radio maps might look seen from a close observer, the other columns show how the map might look from Earth with our vision blurred by gas in interstellar space (from Bromley et al. 2001)
Indeed, in parallel with but rather independently from the theoretical simulations reviewed here, the work to image SgrA* by VLBI experiments had begun also back in the 1970’s, after the discovery of the compact radio source Sgr A* at the center of the Milky Way and its identification as the likely emission of gas falling onto a supermassive black hole (Balick and Brown 1974). And as soon as it was realized that the shadow of SgrA* could really be photographed in the forthcoming years, the program of imaging black holes with or without accretion disks and/or stellar background field developed at a much accelerated rate. Several dozens of papers with more or less elaborate visualizations bloomed out, so many that I’ll stop my illustrated history of black hole imaging at this turning point.
As already suspected a long time ago, the gravitational dynamics of stars orbiting the Galactic Center SgrA, as observed for more than 20 years, give a good estimate for the centeal black hole mass : 4.4 millions solar masses. Credit : Keck Observatory.
On the observational side, successive radio imaging observations progressively reduced the size of emission region if SgrA*. A breakthrough was to extend VLBI to 1mm wavelength, where the scattering effects are greatly reduced and angular resolution is matched to the shadow of the galactic black hole. Then the collective effort was named the “Event Horizon Telescope” as the natural convergence of many historical and parallel works done by several independent teams in the world (Doeleman et al. 2009). The later measurement of the size of the 6 billion solar mass black hole in M87 gave a second source suitable for shadow imaging (Doeleman et al. 2012).
Optical image of the giant elliptical galaxy M87 taken by the Hubble Space Telescope. Its core emits an enormous jet of relativistic plasma. At its very center, M87 harbours the second-largest black hole as seen from Earth, M87*, with a mass of 6.6 billion Suns but over 2000 times farther away than Sagittarius A*.
Now the Event Horizon Telescope Consortium involves 20 universities, observatories, research institutions, government agencies and more than a hundred scientists who hope to make black hole imaging a reality as soon as 2019. The first telescopic image of M87* was delivered on April 10th, 2019.
Sheperd Doeleman, director of the Event Hoziron Telescope, at the press conference of April 10th 2019 in which the first telescopic image of black hole M87* was shown.
The path from idea to reality can take very a long time. Imaging black holes, first with computers, now with telescopes, is a fantastic adventure. Forty years ago I couldn’t hope that a real image would be reachable in my lifetime and that, thanks to contributions by so many dedicated colleagues, my dream would become true.
In May 2019 I was invited to give the keynote talk at the 3rd Black Hole Initiative Conference at Harvard University and I could warmly congratulate the EHT team. The young commputer scientist Katie Bouman led the development of one of the various algorithms for imaging black holes. We were glad to meet each other, the young and the old !
With Katie Bouman on 21 May 2019 at the Black Hole Initiative Conference, Harvard University
Here is the video of my talk :
Technical References for the 3 posts
Abramowicz, M., Jaroszynski, M., Sikora, M. : Relativistic accreting disks, Astron. Astrophys. 63, 221 (1978).
Balick, B., Brown, R.L. : Intense sub-arcsecond structure in the galactic center, Astrophys. J. 194, 265-270 (1974).
Bardeen, J. M. 1973, Timelike and null geodesics in the Kerr metric, in Black Holes (Les Astres Occlus), ed. C. Dewitt & B. S. Dewitt, New York: Gordon and Breach, pp.215–239.
Bromley, B., Chen, K., Miller,W. : Line Emission from an Accretion Disk around a Rotating Black Hole: Toward a Measurement of Frame Dragging, Astrophys.J. 475, 57 (1997).
Bromley, B., Melia, F., Liu, S. : Polarimetric Imaging of the Massive Black Hole at the Galactic Center, Astrophys.J. 555, L83-86 (2001).
Carter B. : Axisymmetric Black Hole Has Only Two Degrees of Freedom, Physical Review Letters 26, 331 (1971).
Carter B. , Luminet, J.-P. : Les Trous Noirs, Maelströms cosmiques, La Recherche 94, 944 (1978).
Carter B. , Luminet, J.-P. : Pancake Detonation of Stars by Black Holes in Galactic Nuclei, Nature 296, 211 (1982).
Chatzopoulos, S., Fritz, T. K., Gerhard, Gillessen, O., S. , Wegg, C. , Genzel, R. , Pfuhl, O. : The old nuclear star cluster in the Milky Way: dynamics, mass, statistical parallax, and black hole mass, MNRAS, 447, 948 (2015)
Cunningham, C. T. : The effects of redshifts and focusing on the spectrum of an accretion disk around a Kerr black hole, Astrophys. J., 202, 788 (1975)
Cunningham, C.T., Bardeen J.M. : The optical appearance of a star orbiting an extreme Kerr black hole, Astrophys. J.173 L137-142 (1972).
Cunningham, C.T., Bardeen J.M. : The optical appearance of a star orbiting an extreme Kerr black hole, 1973, Astrophys. J., 183, 237
Davelaar, J., Bronzwaer, T., Kok, D., Younsi, Z., Moscibrodzka, M., Falcke, H.: Observing supermassive black holes in virtual reality, Computational Astrophysics and Cosmology 5,1 (2018). https://doi.org/10.1186/s40668-018-0023-7
Delesalle, L. , Lachièze-Rey, M. , Luminet, J.-P. : Infiniment Courbe, TV documentary, 52 mn, France: CNRS/Arte, 1994.
Doeleman, S.S., et al. : Structure of Sagittarius A* at 86 GHz using VLBI closure quantities, Astron. J., 121, 2610-2617 (2001).
Doeleman, S.S., et al. : Event-horizon-scale structure in the supermassive black hole candidate at the Galactic Centre, Nature, 455, 78 (2008).
Doeleman, S.S., et al. : Imaging an Event Horizon : submm-VLBI of Super massive Black Hole, The Astronomy and Astrophysics Decadal Survey, Science White Papers, no. 68 (2009).
Doeleman, S.S., et al. : Jet-Launching Structure Resolved Near the Supermassive Black Hole in M87, Science 338 (6105), 355 (2012).
Falcke, H. : Imaging black holes : past, present and future, Journal of Physics : Conf. Series 942, 012001 (2017)
Falcke, H., Melia, F., Agol, E. : Viewing the Shadow of the Black Hole at the Galactic Center, Astrophys. J. Lett. 528, L13–L16 (2000).
Fanton C., Calvani M., de Felice F., Cadez A. : Detecting Accretion Disks in Active Galactic Nuclei, Publ. Astron. Soc. Japan 49, 159-169 (1997).
Fukue, J., Yokoyama, T. : Color Photographs of an Accretion Disk around a Black Hole, Publications of the Astronomical Society of Japan 40, 15–24 (1988).
Goddi, C., Falcke, H., et al.: BlackHoleCam: fundamental physics of the galactic center. Int. J. Mod. Phys. D 26, 1730001-239 (2017).
Hamilton, A.: Falling into a black hole. http://jila.colorado.edu/~ajsh/insidebh/intro.html (1998-2018). Accessed 2019-02-26.
Hills, J.G. : Possible power source of Seyfert galaxies and QSOs, Nature 254, 295 (1975).
James, O., von Tunzelmann, E., Franklin, P., Thorne, K.S.: Gravitational lensing by spinning black holes in astrophysics, and in the movie Interstellar. Class. Quantum Gravity 32(6), 065001 (2015).
Johnson, M. D. , Bouman, K. L., Blackburn, L. L. , Chael, A. A., Rosen, J. , Shiokawa, H. , Roelofs, F. , Akiyama, K. , Fish, V. L. , Doeleman S. S. : Dynamical Imaging with Interferometry, Astrophys. J., 850(2), 172 (2017).
Kerr, R.P. : Gravitational Field of a Spinning Mass as an Example of Algebraically Special Metrics, Physical Review Letters 11, 237 (1963).
Kormendy, J., Ho, L. : Supermassive Black Holes in Inactive Galaxies, Encyclopedia of Astronomy and Astrophysics, ed. P.Murdin, article id. 2635. Bristol : Institute of Physics Publishing (2001).
Luminet J.-P.: Seeing Black Holes : from the Computer to the Telescope, Universe 4(8), 86 (2018) [arXiv :1804.03909].
Luminet, J.-P. : Black Holes, Cambridge University Press, 1992.
Luminet, J.-P. : Interstellar Science, International Review of Science vol.1 n°2 (march 2015) [arXiv : 1503.08305].
Luminet, J.-P.: Image of a Spherical Black Hole with Thin Accretion Disk, Astron.Astrophys. 75, 228 (1979).
Marck J.-A., Luminet, J.-P. : Plongeon dans un trou noir, Pour la Science Hors-Série Les trous noirs (July 1997) 50–56.
Marck, J.-A. : Colored images of a black hole accretion disk for various angles of view, unpublished (1989).
Marck, J.-A. : Flight into a Black Hole, videocassette 11 mn, Meudon : CNRS Images (1994).
Marck, J.-A. : Short-Cut Method of Solution of Geodesic Equations for Schwarzschild Black Hole, Classical and Quantum Gravity13(3) 393–402 (1996).
Marrone, D. P., Moran, J. M., Zhao, J.-H., Rao, R. : An Unambiguous Detection of Faraday Rotation in Sagittarius A*, Astrophys. J. Lett. 654, L57 (2007).
Nemiroff, R. : Visual distortions near a neutron star and black hole, Am. J. Phys. 61, 619 (1993) [astro-ph/9312003].
Nerval, G. de : Le Christ aux Oliviers, in Les Chimères, Paris, 1854. Free translation by J.-P. Luminet.
Ohanian, H. C. : The Black Hole as a Gravitational ‘Lens’, Am. J. Phys. 55, 428-432 (1987).
Page, D.N., Thorne, K.S. : Disk Accretion onto a Black Hole. I. Time-Averaged Structure of Accretion Disk, Astrophys. J. 191, 499-506 (1974).
Palmer L., Pryce M. & Unruh W. : Simulation of starlight lensed by a camera orbiting a Schwarzschild black hole, unpublished (1978).
Pounds, K. A. et al. : An ultra-fast inflow in the luminous Seyfert PG1211+143, Monthly Notices of the Royal Astronomical Society 481(2), 1832-1838 (2018).
Pringle, J. E., Rees, M. J. : Accretion Disc Models dor Compact X-ray Sources, Astron. Astrophys. 21 , 1 (1972).
Riazuelo, A. : Seeing relativity I. Ray tracing in a Schwarzschild metric to explore the maximal analytic extension of the metric and making a proper rendering of the stars, (2018) [ArXiv :1511.06025]
Sargent, W. L., Young, P. J., Lynds, C. R., et al. : Dynamical evidence for a central mass concentration in the galaxy M87, Astrophys. J. 221, 731–744 (1978).
Schastok, J. , Soffel, M. , Ruder, H., Schneider, M. : Stellar Sky as Seen From the Vicinity of a Black Hole, Am. J. Phys., 55, 336-341 (1987).
Shaikh, R. : Shadows of rotating wormholes, Phys. Rev. D 98, 024044 (2018) [arXiv :1803.11422]
Shakura, N.I., Sunyaev, R. A. : Black holes in binary systems. Observational appearance. Astro. Astrophys. 24, 337-355 (1973)
Stuckey, W. M. : The Schwarzschild Black Hole as a Gravitational Mirror, Am. J. Phys. 61(5), 448-456 (1993).
Thorne K.: TheScienceofInterstellar, Norton & Company (november 2014).
Thorne, K, private communication, 24/10/2014
Viergutz S U. : Image Generation in Kerr Geometry. I. Analytical Investigations on the Stationary Emitter-Observer Problem, Astron. Astrophys. 272, 355–77 (1993) ; Viergutz, S.U. : Radiation from arbitrarily shaped objects in the vicinity of Kerr Black Holes, Astrophys. Space Sci. 205, 155 (1993).
In 1989-1990, while I spent one year as a research visitor at the University of California, Berkeley, my former collaborator at Paris-Meudon Observatory, Jean-Alain Marck, both an expert in general relativity and computer programming, started to extend my simulation of 1979. The fast improvement of computers and visualization software (he used a DEC-VAX 8600 machine) allowed him to add colors and motions. To reduce the computing time, Marck developed a new method for calculating the geodesics in Schwarzschild space-time, published only several years later (Marck 1996). In a first step Marck started from my model of 1979 and calculated static images of an accretion disk around a Schwarzschild black hole according to various angles of view, see Figure 1 below.
Figure 1. False-Coloured images of a black hole accretion disk for various angles of view by J.-A. Marck & J.-P. Luminet , 1989 (unpublished).
In 1991, when I went back to Paris Observatory, I started the project for the French-German TV channel Arte of a full-length, pedagogical movie about general relativity (Delesalle et al. 1994). As the final sequence dealt with black holes, I asked Marck to introduce motion of the observer with the camera moving around close to the disk, as well as to include higher-order lensed images and background stellar skies in order to make the pictures as realistic as possible. The calculation was done along an elliptic trajectory around a Schwarzschild black hole crossing several times the plane of a thin accretion disk and suffering a strong relativistic precession effect (i.e. rotation of its great axis), see figure 2 below.
Compared to my static, black-and-white simulation of 1979, the snapshot reproduced in Figure 3 below shows spectacular improvements:
Figure 3. Colored image of a black hole accretion disk as seen by a moving observer at 7° above the disk’s plane. The observer uses a camera equipped with filters to convert into optical radiation the emitted electromagnetic radiation. The arbitrary coloring encodes the apparent luminosity of the disk, the brightest and warmest parts being colored yellow, the colder parts red. The transparency of the disk was enhanced in order to show the secondary image through the primary, as well as some background stars. Compared with figure 8 there are additional distortions and asymmetries due to the Doppler effect induced by the motion of the observer himself. As a result the region of maximum luminosity has no more the shape of a crescent (from Marck 1991)
The full movie is available on my youtube channel :
Any model of the universe must incorporate the mechanisms determining the motion of the planets and other celestial bodies. From Plato and Aristotle to Kepler, astronomers could not imagine the universe governed by shapes other than circles and spheres, the only geometric forms that could possibly represent divine perfection. This constraint forced them to devise extremely complex systems which would “fit the facts”, in other words account for the apparent movements of the planets and stars as observed from the earth while conforming to the ideological demands of the concept of universal harmony.
Despite the ingenuity of astronomers like Euxodus (see previous post), their circular systems did not accurately describe the complex movements they had observed: the planets accelerated and decelerated and even occasionally went back the way they had come. Moreover, they did not account for the changes in brightness of the planets, which suggested variations in their distance from the earth that were incompatible with the idea that they travelled in circles centred on or near the earth.
How could Aristotelian cosmology be reconciled with astronomical observation? The most elaborate attempt to do so was made by Ptolemy (Claudius Ptolemaeus) in the second century AD. In his Syntaxis Mathematicae, better known by its Latin title Almagest, the Alexandrian thinker succeeded in explaining the motion of each celestial body by a system of extremely elaborate mathematical constructs.
Left : a depiction of Ptolemy at work in a medieval manuscript. Right : A Greek manuscript of the Almagest, IXth century.
Ptolemy adopted the concept of a stationary earth and celestial bodies which could move only in circles. But he multiplied the number of circles and offset them one against the other, proposing complex and ingenious interactions between them. The circle in which a planet moves, called its epicycle, no longer had the earth at its centre as in Eudoxus’ theory, but itself revolved around another circle, called the deferent (or eccentric circle if its own centre is offset from the earth’s position). This theory enabled Ptolemy to “fit the facts” without departing too far from Aristotelian philosophical principles and it survived for 1,500 years — longer than any other idea in the history of science – until the discovery of elliptical orbits by Kepler.
The Motion of the Outer Planets According to Ptolemy. Ptolemy’s theory of planetary morion was first mentioned in his Planetary Hypotheses, which survives only in an Arabic translation, and fully developed in his Almagest. The original Greek title, Syntaxis, means “compendium”, but the work seems to have been known as megiste, “the greatest”, whence the Arabic al-Majesti and subsequently the Latin title Almagestum. The most influential Latin translation was made in 1175 by Gerard of Cremona. The page above, from a later edition of Book X, shows a kinematic model of the motion of the outer planets – Mars, Jupiter and Saturn. The earth remains still while the planets move in a regular pattern relative to an equant point offset from the centre of the planetary sphere. Claude Ptolemy, Almagestum, translated into Latin by Gerard of Cremona, 13th century. Vatican, Biblioteca Apostolica Vaticana, Lat. 2057
Ptolemy’s Epicycles. The Ptolemaic system was based on three geometric patterns: the epicycle, the eccentric circle and the equant. The epicycle had been invented in the third century BC by Apollonius of Perga, a brilliant mathematician whose most famous work is a treatise on conical sections (ellipses, parabolas and hyperbolas), and developed by Hipparchus a century later. (a) Epicycle : a planet P rotates in a small circle (epicycle) whose centre (C) is simultaneously moving along the circumference of a large circle, known as the deferent, with the earth (T) at its centre. (b) Eccentric Circle : the earth is offset from the centre (O) of the deferent. This model breaks the Aristotelian rule which states that the earth must be at the centre of the cosmos. (c) Equant : despite its complexity, the eccentric circle model does not provide a sufficiently accurate explanation of the apparent motion of the planets. Ptolemy therefore postulated an equant point (E) about which the centre of the epicycle (C) rotates. Both the geometric centre of the deferent (O) and the centre of motion are now offset from the earth’s position (T). (d) Final Model : the Ptolemaic model plots the motion of the planets according to this sytem, but it was so complicated that it was not fully understood by Western civilisation until the 15th century. Ptolemy proudly defended its complexity: “We must as far as possible apply the simplest hypotheses to the movements of celestial bodies but, if these are inadequate, we must find others which explain them better.” (Almagest, XII, 2) – a statement which placed him firmly in the vanguard of modern scientific thinking.
Nevertheless, the system of epicycles and eccentric circles suggested that the earth was not exactly at the centre of the cosmos and Islamic astronomers raised several objections to this infringement of Aristotelian harmony. It was the existence of an equant point offset from the earth that particularly preoccupied later scientists. Copernicus, for example, in his De Revolutionibus announced his intention to rid the celestial model of this “monstrosity”. Continue reading Geometry and the Cosmos (3) : from Ptolemy’s circles to Inflationary Cosmology→
Black holes are to many the most mysterious objects in space. According to the laws of General Relativity, they are by themselves invisible. Contrarily to non-collapsed celestial bodies, their surface is neither solid nor gaseous ; it is an immaterial border called the event horizon, beyond which gravity is so strong that nothing can escape, not even light.
Seen in projection on a sky background, the event horizon would have the aspect of a perfectly circular black disk if the black hole is static (the so-called Schwarzschild solution) or of a slightly distorted one if it is in rotation (the Kerr solution). Due to strong gravitational lensing, such a « bare » black hole could leave an observable imprint on a starry background. However, in typical astrophysical conditions, whatever its size and mass (ranging from stellar to galactic scales) a black hole is rarely bare but is dressed in gaseous material. Swirling in a spiral motion, the gas forms a hot accretion disk within which it emits a characteristic spectrum of electromagnetic radiation. Giant black holes, such as those currently lurking at the centers of galaxies, can be also surrounded by a stellar cluster, whose orbital dynamics is strongly influenced. As a matter of fact, , if a black hole remains by itself invisible, it “switches on” in its characteristic way the materials it attracts, and distorts the background starry field by gravitational lensing.
Thus, as soon as the basics of black holes astrophysics developed in the 1970’s, the scientists logically wondered what could look like a black hole. Many of you certainly saw didactic or artistic representations of a black hole in popular science magazines, in the form of a black sphere floating in the middle of a circular whirlwind of brilliant gas. So striking they are, these images fail to report the astrophysical reality. This one can be correctly described by means of numerical simulations, taking into account the complex distortions that the strong gravitational field prints in spacetime and light rays trajectories.
Since the first numerical simulations performed 40 years ago, tantalizing progress has been done to detect black holes through electromagnetic radiation from infalling matter or gravitational waves. The first telescopic image by the Event Horizon Telescope of the nearest giant black hole SgrA*, lurking at he center of our Milky Way galaxy, is expected for 2018.
The aim of this series of posts is to retrace the rich history of black hole imaging.
Preliminary steps
Black hole imaging started in 1972 at a Summer school in Les Houches (France). James Bardeen, building on earlier analytical work of Brandon Carter, initiated research on gravitational lensing by spinning black holes. Bardeen gave a thorough analysis of null geodesics (light-ray propagation) around a Kerr black hole. The Kerr solution had been discovered in 1962 by the New Zealand physicist Roy Kerr and since then focused the attention of many searchers in General Relativity, because it represents the most general state of equilibitum of an astrophysical black hole.
The Kerr spacetime’s metric depends on two parameters : the black hole mass M and its normalized angular momentum a. An important difference with usual stars, which are in differential rotation, is that Kerr black holes are rotating with perfect rigidity : all the points on their event horizon move with the same angular velocity. There is however a critical angular momentum, given by a = M (in units where G=c=1) above which the event horizon would « break up » : this limit corresponds to the horizon having a spin velocity equal to the speed of light. For such a black hole, called « extreme », the gravitational field at the event horizon would cancel, because the inward pull of gravity would be compensated by huge repulsive centrifugal forces.
James Bardeen computed how the black hole’s rotation would affect the shape of the shadow that the event horizon casts on light from a background star field. For a black hole spinning close to the maximum angular momentum, the result is a D-shaped shadow.
Apparent shape of an extreme Kerr black hole as seen by a distant observer in the equatorial plane, if the black hole is in front of a source of illumination with an angular size larger than that of the black hole. The shadow bulges out on the side of the hole moving away from the observer (at right) and squeezes inward and flattens on the side moving toward the observer (at left).
The reference is Bardeen, J. M. 1973, Timelike and null geodesics in the Kerr metric, in Black Holes (Les Astres Occlus), ed. C. Dewitt & B. S. Dewitt, (New York: Gordon and Breach) p.215–239
At the time, C.T. Cunningham was preparing a PhD thesis at the University of Washington in Seattle, under the supervision of Bardeen. He began to calculate the optical appearance of a star in circular orbit in the equatorial plane of an extreme Kerr black hole, taking account of the Doppler effect due to relativistic motion of the star, and pointed out the corresponding amplification of the star’s luminosity. He gave formulas but did not produced any image. The reference is Cunningham, C.T. and Bardeen J.M., The optical appearance of a star orbiting an extreme Kerr black hole, ApJ 173 L137-142 (1972).
One year later Cunningham and Bardeen published a more complete article with the same title. For the first time a picture was shown of the primary and secundary images of a point source moving in a circular orbit in the equatorial plane of an extreme Kerr black hole. They calculated as functions of time the apparent position and the energy flux of the point source as seen by distant observers.
Apparent positions of the two brightest images as functions of time for two orbital radii and an observer art a polar angle 84°.024. The small, dashed circle in each plot gives the scale of the plot in units of M. The direct image moves along the solid line, the secundary image along the dashed line. Ticks mark the positions of the images at 10 equally spaced times.
In the upper diagram showing the distorted image of a circle of radius 20M, we clearly see that, whatever the observer’s inclination angle, the black hole cannot mask any part of the circle behind. We also see that the black hole’s spin hardly affects the symmetry of the primary image (although the asymmetry is stronger for the secundary image). The exact reference is Cunningham, C.T. and Bardeen J.M., The optical appearance of a star orbiting an extreme Kerr black hole, 1973, ApJ, 183, 237. The article can be uploaded here.
In 1975, Cunningham calculated the effects of redshifts and focusing on the spectrum of an accretion disk around a Kerr black hole. He gave formulas and drawed graphics but no image. The reference is Cunningham, C. T., The effects of redshifts and focusing on the spectrum of an accretion disk around a Kerr black hole, ApJ, 202, 788 (1975)
In 1978 Leigh Palmer, Maurice Pryce and William Unruh carried out, for pedagogical purpose, a simulation of starlight lensed by a camera orbiting a Schwarzschild black hole, using an Edwards and Sutherland Vector graphics display at Simon Fraser University. They showed a film clip in a number of lectures in that period, but unfortunately they did not publish their simulation, so that I can’t reproduce here any image.
First calculations for a black hole accretion disk
The same year and quite independently, as a young researcher at Paris-Meudon Observatory specialized in the mathematics of General Relativity, I wondered what could be the aspect of a Schwarzschild black hole surrounded by a luminous accretion disk. Continue reading 40 Years of Black Hole Imaging (1): Early work 1972-1988→
Since He [Zeus] himself hath fixed in heaven these signs, The Stars dividing; and throughout the year Stars he provides to indicate to men The seasons’ course, that all things may duly grow. Aratus, Phaenomena, I, 18.
Although Kepler was the first to determine the motion of the planets by mathematical laws, his search for a rational explanation to the universe was anticipated by numerous earlier thinkers. Even before the time of Socrates a number of philosophers had broken away from accepted mythology and postulated the idea of universal harmony. From the sixth century BC increasingly rational and mathematical ideologies based on the laws of physics began to compete with the traditional belief that the world was controlled by gods with supernatural powers. Most of these thinkers attempted to describe natural phenomena in mechanical terms, with reference to the elements of water, earth and fire. The Ionian philosophers in particular developed new ideas about the heavens, whose signs were used by many of their compatriots to navigate between the islands. Their fundamental notion was that the universe was governed by mechanical laws, by natural principles which could be studied, understood and predicted.
It was Thales of Miletus who propounded one of the first rational explanations of the world, according to which the earth was separate from the sky. Anaximander and Anaximenes, both also natives of Miletus on the coast of Asia Minor, put forward different ideas, which nevertheless derived from the same rationale: they proposed the existence of cosmological systems, explained natural phenomena in terms of a small number of “elements”, and invented new concepts – Anaximander’s “equilibrium” and Anaximenes’ “compression” – which can be regarded as the first recognition of the force of gravity.
The Expanding Universe. According to Empedocles of Acragas (now Agrigento, in Sicily), the universe was held in balance by forces of harmony and conflict, the attractive force of love and the repulsive force of hate alternatively prevailing. This idea of balance can be seen as a mythical precursor of modern astronomical theories whereby the tendency for structures to become compressed by their own gravitational forces is offset by the expansion of the universe, which constantly dilutes all matter. In Lemaître’s so-called “hesitating universe”, a cosmological model he devised in 1931 from Einstein’s field equations, the evolution of the cosmos is divided into three disctinct phases : two periods of rapid expansion are separated by a period of “stagnation”, representing a sort of equilibrium between the forces of gravitational contraction and expansion.
According to Heraclitus of Ephesus, the day was caused by exhalations from the sun, while the night was the result of dark emissions from the earth. The stars and the planets were bowls of fire which, when turned over, gave rise to eclipses and the phases of the moon. The moon itself, pale and cold, moved in the rarefied air above the earth, whereas the sun, our nearest star, was bright and hot.
Meanwhile, the Greeks were amassing measurements which would enable them to plot the stars more accurately. This required specialised instruments – gnomons to measure the sun’s shadow, compasses to fix the positions of the stars in the sky, etc. – as well as a system of notation which anyone could understand (previously the study of astronomy had been restricted to priests): how many fingers’ width above the horizon was such and such a star; where was due north, and so on. As well as mining the extensive archive of observations made by the Egyptians and Babylonians, the Greeks developed their own system of records. The pre-Socratic thinkers refined and analysed the basic ideas of their predecessors from Miletus with the result that the mechanistic view of the world gradually lost currency and a belief in underlying harmony became de rigueur. As early as 450 BC Anaxagoras of Clazomenae was accused of impiety for referring to the sun as a mass of hot metal, to the moon as a second earth and to the stars as burning stones – views no longer considered seemly. Continue reading Geometry and the Cosmos (2) : From the Pre-Socratic Universe to Aristotle’s Two Worlds→
The regularity of so much celestial activity has led many cultures to base their models of the universe on concepts of order and harmony. Around the Mediterranean it was the Pythagoreans who first expressed the idea that the universe is characterised by proportion, rhythm and numerical patterns. Plato’s hypothesis was of an organised cosmos whose laws could be deciphered, explained in geometric terms.
The history of physics is nothing other than the story of man’s desire to uncover the hidden order and harmony of things. The most ambitious physicists have attempted to unify apparently discrete phenomena: Galileo with terrestrial and celestial laws; Newton with gravity and the movement of celestial bodies; Maxwell with magnetism and electricity; Einstein with space and time; today’s physists with gravitation and microphysics.
But, as Heraclitus said as long ago as 500 BC, “Nature loves to hide.” Indeed advances in geometry and mathematics have led to new theories of the cosmos which we are unable to comprehend. They provide only abstract images, which do not allow us to visualise the structure of atoms or the dynamics of space-time or the topology of the universe in any direct sense.
It is this fundamental belief in celestial harmony – for which successive generations have found various elaborate expressions: just proportion, equation of the part and the whole, symmetry, constancy, resonance, group theory, strings -that has underlain the development of physics for the past 2,500 years.
Melancholy, or the Spirit of Man in Search of the Secret of the Universe. This etching, dating from 1514 according to the numbers in the square in the top right corner, depicts man contemplating the nature of the world in a state of melancholy, which in medieval times was associated with black bile and with the planet Saturn. The winged man prefigures Johannes Kepler’s interrogations as he calculates how to express the underlying harmony of the cosmos using spheres and polyhedra. The bright light in the sky is the great comet that was observed in the winter of 1513-14. As it shines on the scales (depicting the astronomical sign Libra) it symbolises the end of an earthly cycle, if not the end of time itself. The ladder with seven rungs represents the belief held by the Byzantines that the world would not exist for more than seven thousand years. It is the end of the Middle Ages; Diirer (1471-1528) is to be one of the prime movers of the Renaissance.
Geometry and the Cosmos
“Geometry, which before the origin of things was coeternal with the divine mind and is God himself […], supplied God with patterns for the creation of the world.” Johannes Kepler, The Harmony of the World, 1619.
The 17th century German astronomer Johannes Kepler was undoubtedly the first to integrate man’s fascination with harmony into an overall vision of the world which can properly be called scientific. For Kepler, as for the natural philosophers of ancient Greece, the cosmos was an organised system comprising the earth and the visible stars. His avowed intention was to investigate the reasons for the number and sizes of the planets and why they moved as they did. He believed that those reasons, and consequently the secret of universal order, could be found in geometry. Kepler wanted to do more than create a simple model or describe the results of his experiments and observations; he wanted to explain the causes of what he saw. This makes him one of the greatest innovators in the history of science and it led him in particular to formulate laws of planetary motion which are still valid today.
Despite his innovative methods, Kepler wrote two studies of the cosmos in the style of the ancient Greeks: Mysterium Cosmographicum (The Secret of the Cosmos) in 1596 and Harmonices Mundi (The Harmony of the World) in 1619. At this turning point between ancient and modern thinking Kepler was steeped in a tradition which connected cosmology explicitly with the notion of divine harmony. But what Kepler sought to express was not the numerical mysticism of the Pythagoreans; his starting point was geometric patterns, which he saw as “logical elements”. His profound desire to devise a rational explanation for the cosmos led him to establish procedures which resembled those of modern science. Continue reading Geometry and the Cosmos (1) : Kepler, from polyhedra to ellipses→
There, where worlds seem, with slow steps, Like an immense and well-behaved herd, To calmly graze on the ether’s flower. Giovanni Pascoli, Il Ciocco
A question often asked by the general public interested in cosmology about the expansion of the Universe is the distance scales on which it effectively acts. Before commenting on this, let me recall first some historical facts.
Georges Lemaître in 1927
In 1927, Georges Lemaître published a revolutionary article in the Annales de la Société scientifique de Bruxelles entitled “Un univers homogène de masse constante et de rayon croissant, rendant compte de la vitesse radiale des nébuleuses extragalactiques” (“A homogeneous universe of constant mass and increasing radius, accounting for the radial velocity of extragalactic nebulae.” As the title suggests, Lemaître showed that a relativistic cosmological model of finite volume, in which the Universe is in perpetual expansion, naturally explains the redshifts of galaxies, which at that point were not understood. In particular, the article contained a paragraph establishing that forty-two nearby galaxies, whose spectral shifts had been measured, were moving away at speeds proportional to their distances.
Lemaître gave the numerical value of this proportionality factor: 625 km/s per megaparsec, which means that two galaxies separated by 1 megaparsec (or 3,26 million light-years) moved away from each other at an apparent speed of 625 km/s, and that two galaxies separated by 10 megaparsecs moved apart at a speed ten times greater.
The paragraph of Lemaître’s paper in which he derives the law of proportionality between recession velocity and distance, later called the Hubble law.
This unit of measurement, the kilometer per second per megaparsec, shows clearly that the speed of recession depends on the scale. In 1377, in his Book of the Heavens and the World, the scholar Nicole Oresme had noted that, at dawn, one would not notice anything if the world and all living creatures had grown by the same proportion during the night. In Lemaître’s theory, on the contrary, the recession velocity between two points in space grows faster with greater separation, which renders it perceptible.
Eddington and Lemaître
Lemaître’s article, published in French, passed unnoticed until 1931, when it was finally read by Arthur Eddington, who published an English translation. Unfortunately, this version omits the paragraph in which Lemaître established his law of proportionality, see this article for all the details. Meanwhile, in 1929 the great American astronomer Edwin Hubble had published the experimental results he obtained with his collaborators and described a general law, according to which the speed of recession of a galaxy is proportional to its distance. This law, identical to Lemaître’s, with the same proportionality factor, would from now on carry the name of “Hubble’s law.” It forms the experimental basis for the theory of the expansion of the Universe, of which the big bang models are the fruit. Continue reading The Rate of Expansion→
This post is an adaptation of a chapter of my book “The Wraparound Universe” with many more illustrations.
Galaxies in Flight
The spawning galaxy in flight is a rainbow trout which goes back against the flow of time towards the lowest waters, towards the dark retreats of duration. Charles Dobzynski (1963)
Since the time of Newton, we have known that white light, passing through a prism, is decomposed into a spectrum of all colors. Violet and blue correspond to the shortest wavelengths or, equivalently, to the largest frequencies; red corresponds to the largest wavelengths and to low frequencies. In 1814, the German optician Joseph von Fraunhofer discovered that the light spectrum from stars is streaked with thin dark lines, while that from candlelight has bright stripes. These phenomena remained puzzling until 1859. It was then that the chemist Robert Bunsen and the physicist Gustav Kirchhoff analyzed the light created from the combustion of different chemical compounds (burned with the now-famous Bunsen burner) and saw that each of them emitted light with its own characteristic spectrum.
Fraunhofer lines in the solar spectrum
At nearly the same time, Christian Doppler discovered in 1842 that moving the source of a sound produced shifts in the frequency of sound waves, a phenomenon experienced by anyone listening to the siren of an ambulance passing by. The French physicist Armand Fizeau noticed the same phenomenon with light waves: depending on whether a source of light was moving closer or farther away, the received frequencies are either raised or lowered with respect to the emitted frequencies. The shift becomes larger as the speed of displacement is increased. If the source is getting closer, the frequency grows, and the light becomes more “blue”; if it moves away, the frequency lowers and the wavelengths stretch out, becoming more “red,” with respect to the spectrum of visible light. Since this shift affects the whole spectrum by the same amount, it is easily quantified by looking at the dark or bright stripes, which are shifted together, either towards the blue or towards the red, and it furnishes an incomparable means of measuring the speed of approach or retreat for light sources.
Shortly after this discovery, astronomers began an ambitious program of spectroscopy, with the aim of measuring the speed of the planets and stars by using their spectral shifts. Continue reading Galaxies in Flight→
This post is an adaptation of a chapter of my book “The Wraparound Universe” with many more illustrations.
Expansion and the Infinite
Space alike to itself that it grows or denies itself Stéphane Mallarmé
The Universe is expanding. What does this really mean? Most people imagine an original huge explosion, as the term “big bang” suggests, and the metaphor is constantly used in popular accounts. Some speakers even have the tendency to mime a gesture of expansion with their hands, as if they were holding a piece of space or an immaterial balloon in the process of inflating. The public imagines some matter ejected at prodigious speeds from some center, and tell themselves that it would be better not to be there at the moment of explosion, so as not to be riddled through with particles.
A misleading view of the expanding universe commonly used in popular science
None of all this is accurate. At the big bang, no point in the Universe participated in any explosion. Put simply, if one considers any point whatsoever, we notice that neighboring points are moving away from it. Is this to say that these points are animated by movement, given a speed? No, they are absolutely fixed, and nevertheless they grow apart.
To unravel this paradox, it is necessary to make more precise what one exactly means when speaking of a fixed point. The position of a point is fixed by coordinates: one number for a line (the miles along a highway), two numbers for a surface (latitude and longitude), and three for space in general (length, width, and height). A point is said to be fixed if its coordinates do not change over the course of time. In an arbitrary space, curved or not, the distance between two points is given by the so-called metric formula, which depends on the coordinates and generalizes the Pythagorean theorem. In principle, therefore, the distance between two points does not vary. In an expanding space, on the other hand, this distance grows, while the points do not move, even by a millimeter, meaning that they strictly conserve the same coordinates. These fixed coordinates are known as “comoving” coordinates. In relativistic cosmology, galaxies remain fixed at comoving positions in space. They may dance slight arabesques around these positions, under the influence of local gravitational fields, but the motion which moves them apart from each other resides in the literal expansion of the space which separates them. Continue reading Expansion and the Infinite→
Thus we may perhaps, one day, create new Figures that will allow us to put our trust in the Word, in order to traverse curved Space, non-Euclidean Space. Francis Ponge[1]
The oldest known fragment of Euclid’s Elements as part of the Oxyrhynchus papyri, dated from the Ptolemaic period and belonging to the famous Alexandrian Library
In book I of the Elements,[2] Euclid poses the five “requests” that, according to him, define planar geometry. These postulates would become the keystone for all of geometry, a system of absolute truths whose validity seemed irrefutable. One of the reasons for this faith is that these postulates seem obvious: the first of them stipulates that a straight line passes between two points, the second that any line segment can be indefinitely prolonged in both directions, the third that, given a point and an interval, it is always possible to trace out a circle having the point for its center and the interval as its radius, the fourth that all right angles are equal to each other. The fifth postulate is however less obvious:
As the sum of the interior angles α and β is less than 180°, according to the fifth postulate the two straight lines extended indefinitely, meet on that side.
“If a line segment intersects two straight lines forming two interior angles on the same side that sum to less than two right angles, then the two lines, if extended indefinitely, meet on that side on which the angles sum to less than two right angles.”
Although the statement does not refer explicitly to parallel lines, the the fifth postulate is currently called “Parallel postulate”. This can be better understood given the more popular version of the fifth postulate due to the Scottish mathematician John Playfair (1748-1819), who demonstrated that it was equivalent to the one given by Euclid : “Given a straight line and a point not belonging to this line, there exists a unique straight line passing through the point which is parallel to the first“.
A picturesque English edition of Euclid’s Elements by Oliver Byrne, 1847.
Since the “parallel postulate” was more complicated than the others, the mathematicians following Euclid would try, for many centuries, to prove it from the four preceding ones, all in vain. In the nineteenth century, there occurred one of the great sudden revolutions in the history of mathematics (and also in human thought, as will be seen by what follows): two new geometries which do not satisfy the fifth postulate, but which are perfectly coherent, were discovered. In one of these geometries, called spherical geometry, no parallel line satisfying the conditions can be traced. This is the case for the surface of a sphere; the straight lines become great circles, whose planes pass through the center of the sphere, and since all great circles intersect each other at two diametrically opposed points (in the manner of the terrestrial meridians, which meet at the poles), no “straight line” can be parallel to another.[3] In the other geometry, called hyperbolic geometry, through any given point there passes an infinite number of lines parallel to another straight line. Continue reading Non-Euclidean Geometries→
In view of the total solar eclipse of 2017 Aug 21 through the United States, this is a reminder of the role of solar eclipses in the developments of astronomy and astrophysics. It is taken from a chapter of my book Glorious Eclipses, presented elsewhere in this blog.
Summary
Eclipses of the Sun and Moon have never ceased to provide us with a host of lessons about the nature of the universe around us. The first of these lessons concerned the celestial bodies directly involved in eclipses: namely the Earth, Moon, and Sun. Indeed, back in antiquity, the proof that the Earth was round, and the first measurements of the respective sizes and distances of the Moon and Sun were deduced from the observation of eclipses. In the 19th century, it was the normally invisible atmosphere of the Sun that was revealed thanks to eclipses. Far from being the perfectly round, and sharply defined ball of hot gas that it appears to the eye – appropriately protected by suitable filters, of course – the Sun is found to be a sprawling giant, overflowing with energy, plasma, and particles, that extends its influence throughout the whole Solar System. Eclipses also provoked the discovery of helium, the second most abundant element in the Sun, and in the universe as a whole. In a more surprising manner, in the 20th century, Einstein’s General Relativity, a fundamental theory about space, was tested experimentally for the first time, thanks to an eclipse. It is on this new vision of the universe, which explains gravitation in terms of the ‘curvature of space-time’, that all our current knowledge of the origin, the structure, and the evolution of the universe, depends, by way of the fascinating concepts of an expanding universe, the Big Bang, and black holes.
During a total eclipse, the Sun’s invisible empire appears : eruptions and prominences rise above the level of the photosphere, and colour the Sun’s inner atmosphere, known as the chromosphere.
The Earth is round
According to Aristotle, lunar eclipses prove that the Earth is round. Indeed, if the Earth were square, or triangular, its shadow projected onto the disk of the Moon at the time of an eclipse would not appear circular. Aristotle’s geometrical argument is shown in several ancient astronomy texts, including Cosmographia, by Petrus Apianus and Gemma Frisius, 1581.
The first demonstration of an astrophysical nature resulting from eclipses is the one given by Aristotle concerning the fact that the Earth is round. The astronomical views of this Greek philosopher are well-known to us, thanks to his two works, known to us as Meteorology and On the Heavens, dating from the 4th century BC. Like other thinkers of his day, Aristotle believed that all heavenly bodies were spherical, because to him heavenly bodies were a reflection of divine perfection, and the sphere is the most outstandingly perfect geometrical figure. But this argument was not a physical demonstration, because, naturally, Aristotle did not have any experimental means of confirming the spherical nature of the planets and stars. As far as the Moon was concerned, the philosopher adopted an explanation attributed to the Pythagoreans, namely that the observed appearance of the Moon throughout its various phases corresponded to a spherical body, half of which is illuminated by the Sun. As for the spherical nature of the Earth, the proof given by Aristotle is quite original: he notes that an eclipse of the Moon is caused by the shadow of the Earth, and that the circular shape to the edge of the shadow seen on the Moon’s surface implies that our world is spherical
Sizes and distances of the Moon and Sun
The golden age of Greek astronomy flourished at Alexandria. Since its foundation under the reign of Ptolemy Soter (3rd century BC), the Alexandrian school brought together brilliant mathematicians and geometers, such as Euclid, Archimedes, and Apollonius. Similarly, the greatest ancient astronomers Aristachus of Samos, Eratosthenes, and Hipparchus, as well as Ptolemy (2nd century BC), all worked there.
Aristarchus (310-230 BC) is nowadays known for having been the first to voice the heliocentric theory, i.e., that it is the Sun that reigns at the centre of the world system, not the Earth as was believed at the time. His statement does not appear in any known work, but it was reported by Archimedes and by Plutarch. The only work of Aristarchus that has come down to us relates to the sizes and distances of the Sun and the Moon. The Alexandrian astronomer completely reopened this question, which had been discussed since the 4th century BC. The Pythagoreans had positioned the heights of the celestial bodies according to musical intervals. Eudoxus, the brilliant disciple of Plato, had estimated the diameter of the Sun as nine times that of the Moon. As for Aristarchus, he devised an ingenious geometrical method of calculating the distance ratios of the Sun and Moon.
On the Sizes and Distances of the Sun and the Moon is the only surviving work usually attributed to Aristarchus.
Aristarchus of Samos tried to calculate the relative diameter of the moon and sun, as deduced from the line subtending the arc that divides the light and dark portions of the moon during an eclipse.
He found that the Sun lay at a distance between 18 and 20 times that of the Moon. (In fact, it is 400 times as far.) By an argument based on the observation of eclipses, he determined the diameter of the Moon as one third of that of the Earth, which is very close to the actual value. He also announced that the diameter of the Sun is seven times that of the Earth. Even though Aristarchus considerably underestimated the size of the Sun, because it is actually 109 times as large as the Earth, he had grasped the essential fact that the daytime star was much larger than the Earth. It was precisely this result that led him to the heliocentric hypothesis. He did, in fact, argue that under these circumstances, it was logical to believe that the Earth and the other celestial bodies revolved around the Sun, rather than the reverse. Aristachus was before his time. The world had to wait until 1543 and the work by Copernicus, before the heliocentric theory was again put forward, this time with success.
A century after Aristachus, and again at Alexandria, Hipparchus developed a complete theory of the Moon. He defined the lengths of the synodic month (or lunation, the period in which the Moon returns to the same position relative to the Sun); the draconitic month (the period for the Moon to return to the same position relative to the nodes of its orbit); and the anomalistic month (the period for the Moon to return to perigee or apogee). The immense improvements that Hipparchus brought to theories of the apparent motion of the Moon and Sun enabled him to have far more success than his predecessors in dealing with the problem of predicting eclipses, which had always been of immense interest.
Hipparchus considerably extended Aristarchus’ method: by observing the angular diameter of the shadow of the Earth at the Moon’s distance during a lunar eclipse, and comparing it with the known apparent diameters of the Sun and Moon (about half a degree), he obtained the ratio of the Earth-Moon and Earth-Sun distances, giving one when the other is known. Pappus, another famous astronomer of the Alexandrian school, recounts that Hipparchus made the following observation of: “An eclipse of the Sun, which in the area of the Hellespont was precisely an exact eclipse of the whole Sun; such that none of it was visible, but at Alexandria, in Egypt, about 4/5 of its diameter were hidden. By means of the foregoing arguments, [Hipparchus] showed that, measured in units where the radius of the Earth has the value of 1, the smallest distance to the Moon is 71, and the larger 83. Whence the average of 77.“
The total solar eclipse mentioned is that of 20 November 129 BC. The actual value of the Earth-Moon distance is 60,4 terrestrial radii.
During a total eclipse of the Sun, the electrified plasma hugs the lines of the sun’s magnetic field, just as iron filings follow those of a magnet. The corona displays narrow filaments over the poles, and extends in a more homogeneous manner in the equatorial regions.
The world has no outside, no beyond, since it contains and embraces everything Guillaume d’Auvergne (De Universo, 1231)
If the Universe is finite, it seems necessary for it to have a center and a frontier. The center poses hardly any conceptual difficulty: it suffices to place the Earth there, like the geocentric systems of Antiquity (appearances lead one in this direction), or the Sun, as Copernicus did in his heliocentric system. The notion of an “edge” of the Universe is on the other hand more problematic.
Archytas, born in 428 BC in Tarentum (Italy) and died in 347, was a philosopher, mathematician, astronomer, statesman, and strategist. He belonged to the Pythagorean school and was famous for his scientific abilities.
In the fifth century BCE, the Pythagorean Archytas of Tarentum described a paradox that aimed to demonstrate the absurdity of having a material edge to the Universe. His argument would have a considerable career in all future debates on space: if I were at the extremity of the sky, could I extend my hand or stick out a staff? It is absurd to think that I could not; and if I could, that which is found beyond is either a material body, or space. I could therefore move beyond this once again, and so on. If there is always a new space towards which I can extend my hand, this clearly implies an expanse without limits. There is therefore a paradox: if the Universe is finite, it has an edge, but this edge can be passed through indefinitely.
This line of reasoning was taken up by the atomists, such as Lucretius, who gave the image of a spear thrown to the edge of the Universe, and afterwards by all the partisans of an infinite Universe, such as Nicholas of Cusa and Giordano Bruno. Continue reading The Edge Paradox→
I felt dizzy and wept, for my eyes had seen that secret and conjectured object whose name is common to all men but which no man has looked upon — the unimaginable universe. Jorge luis Borges, The Aleph (1949)
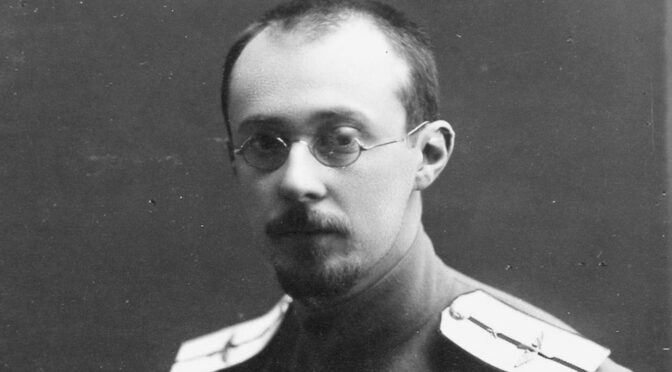
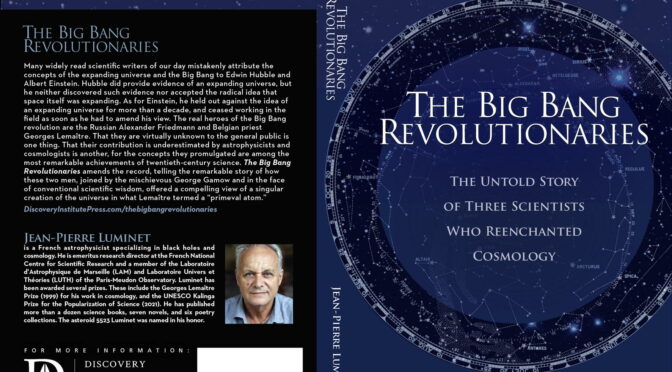
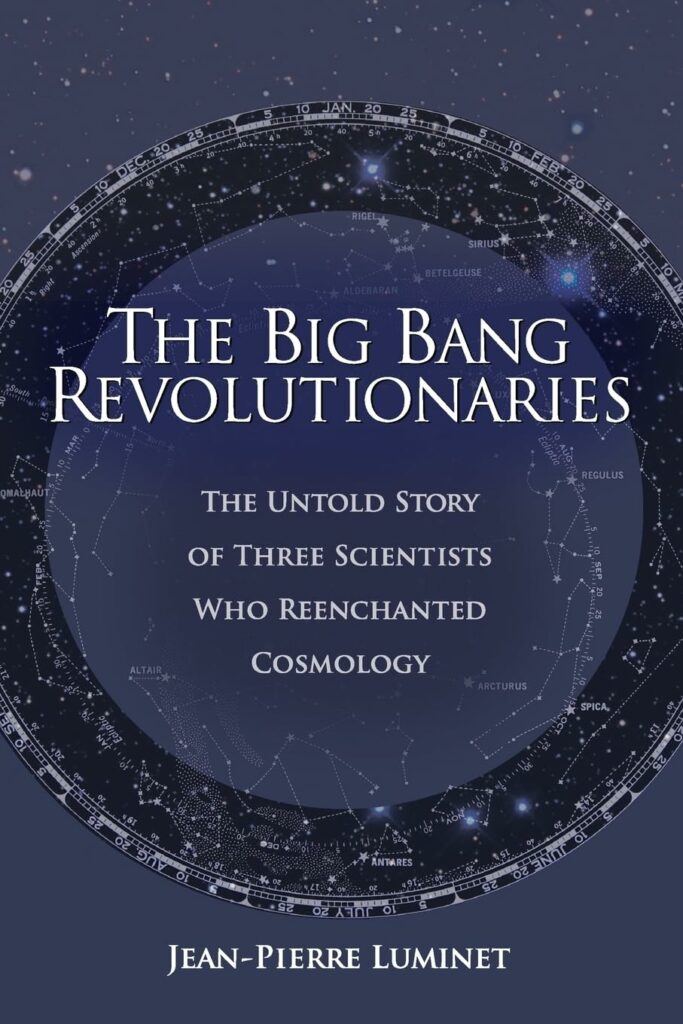
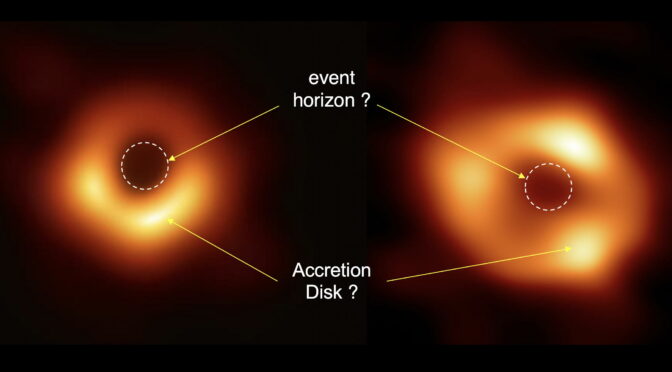
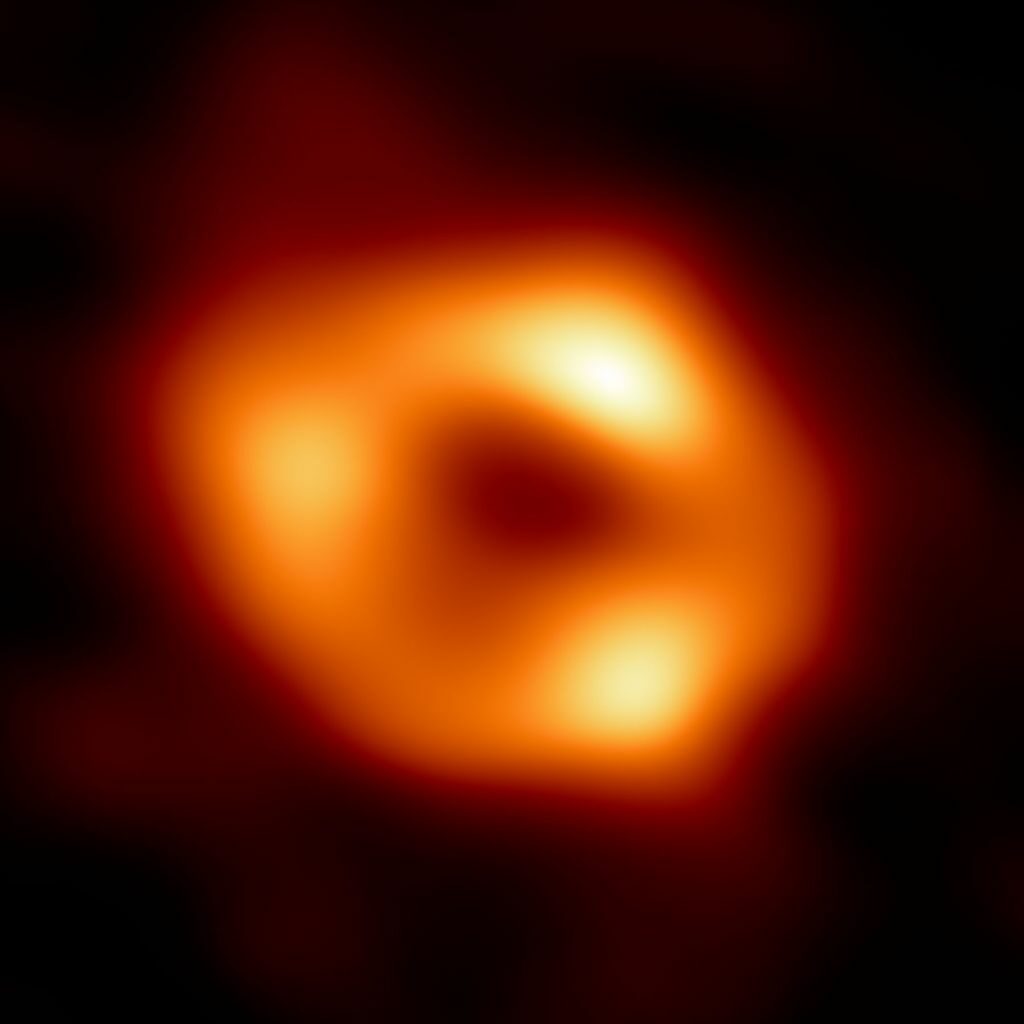
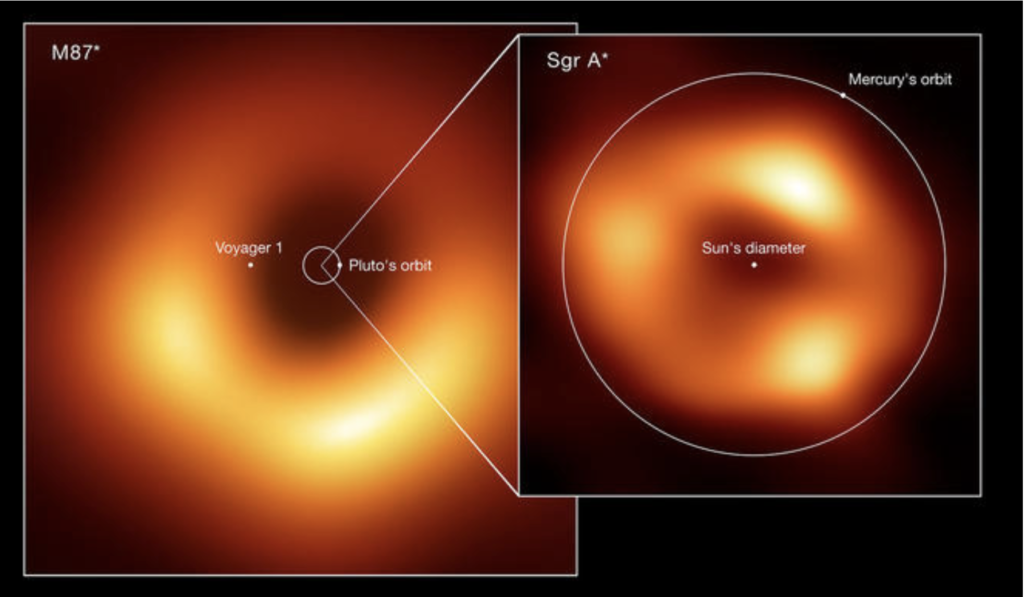
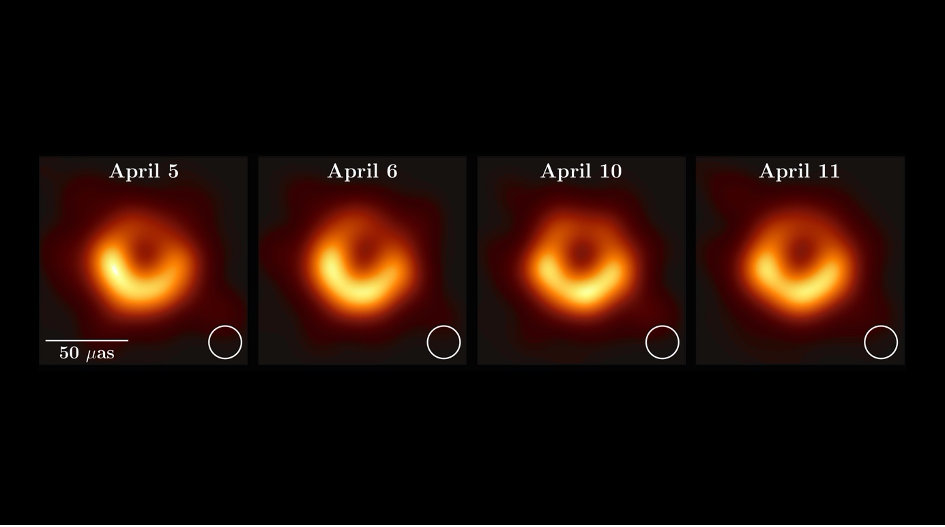
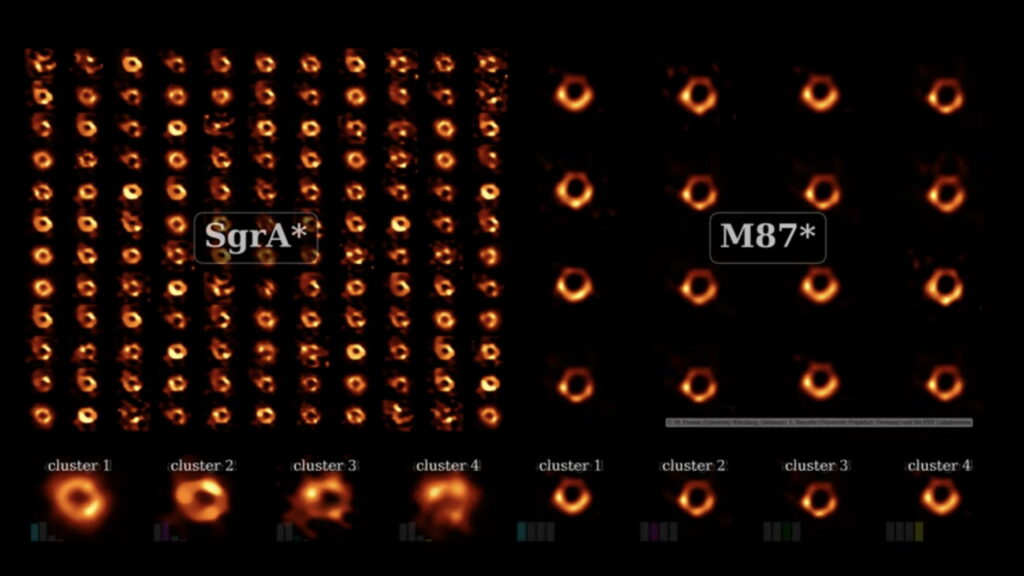
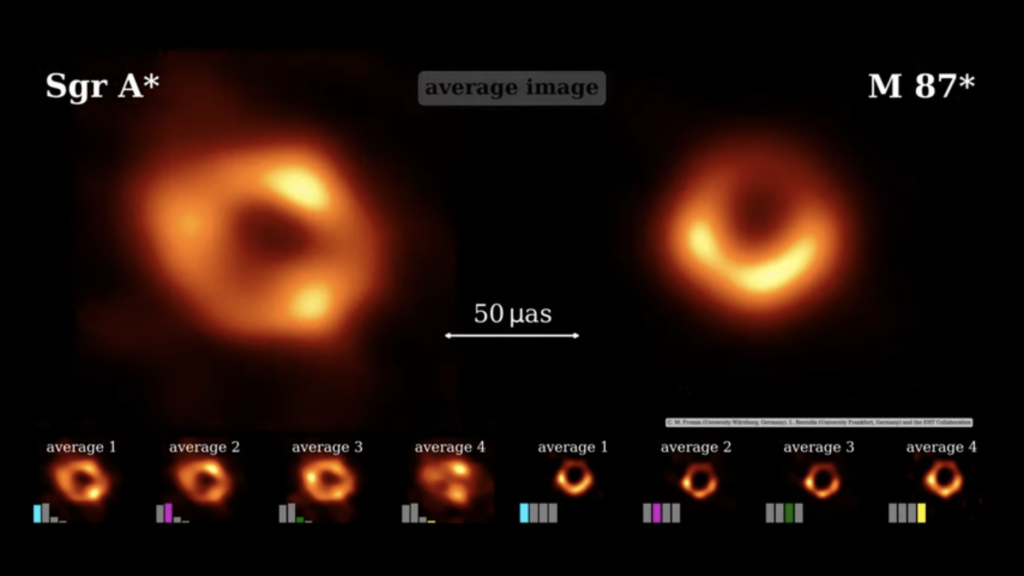
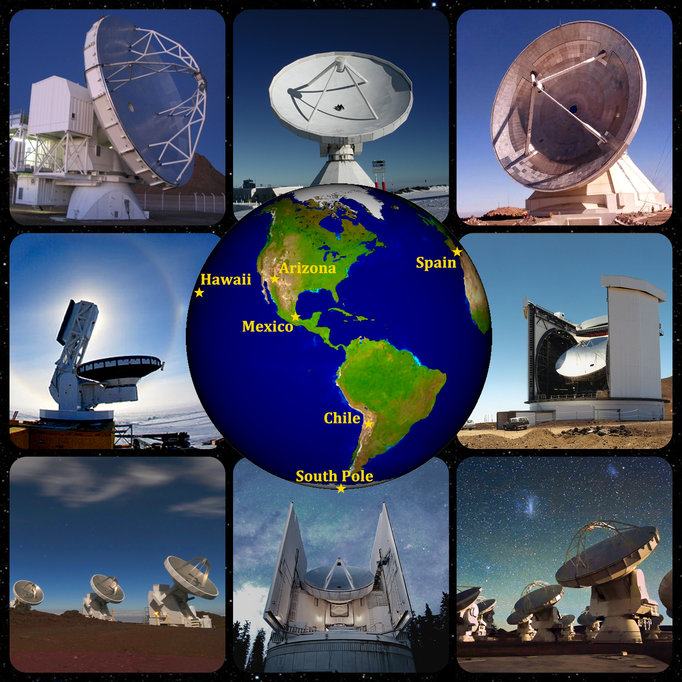
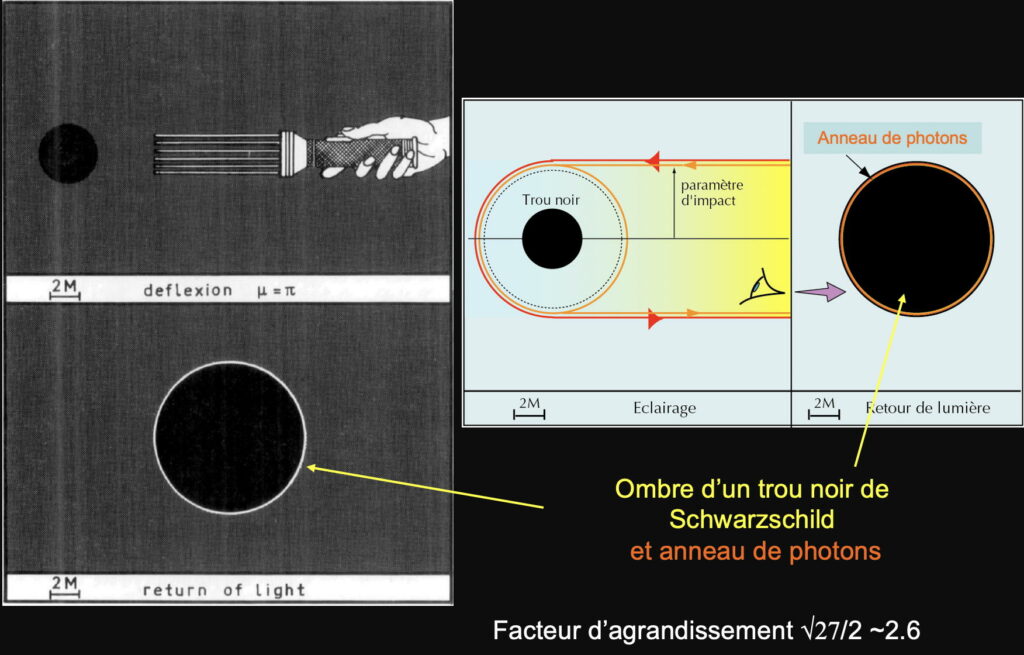
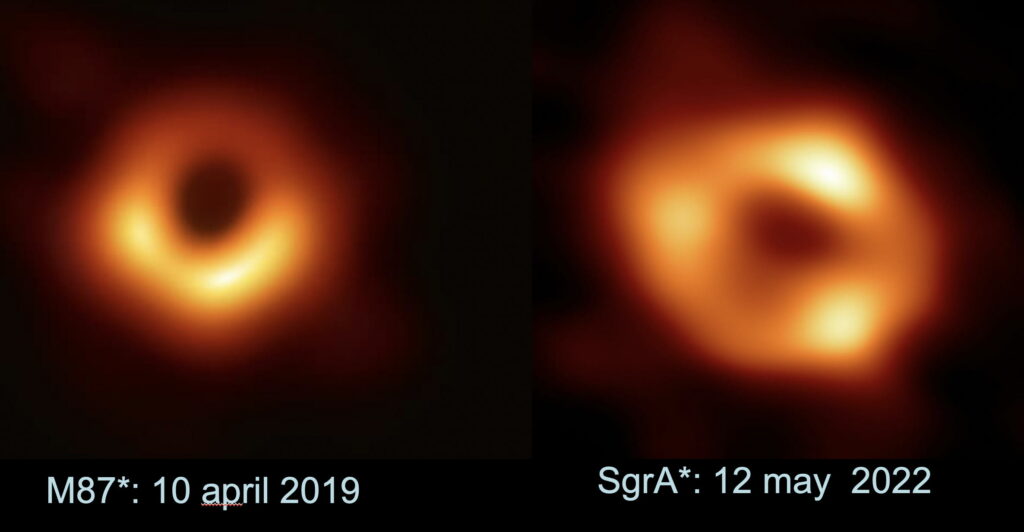
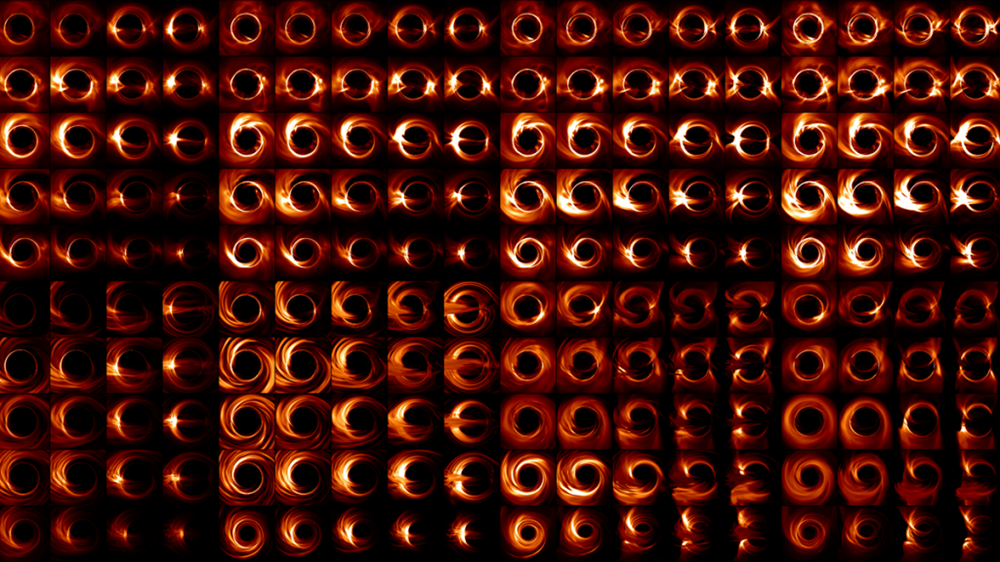
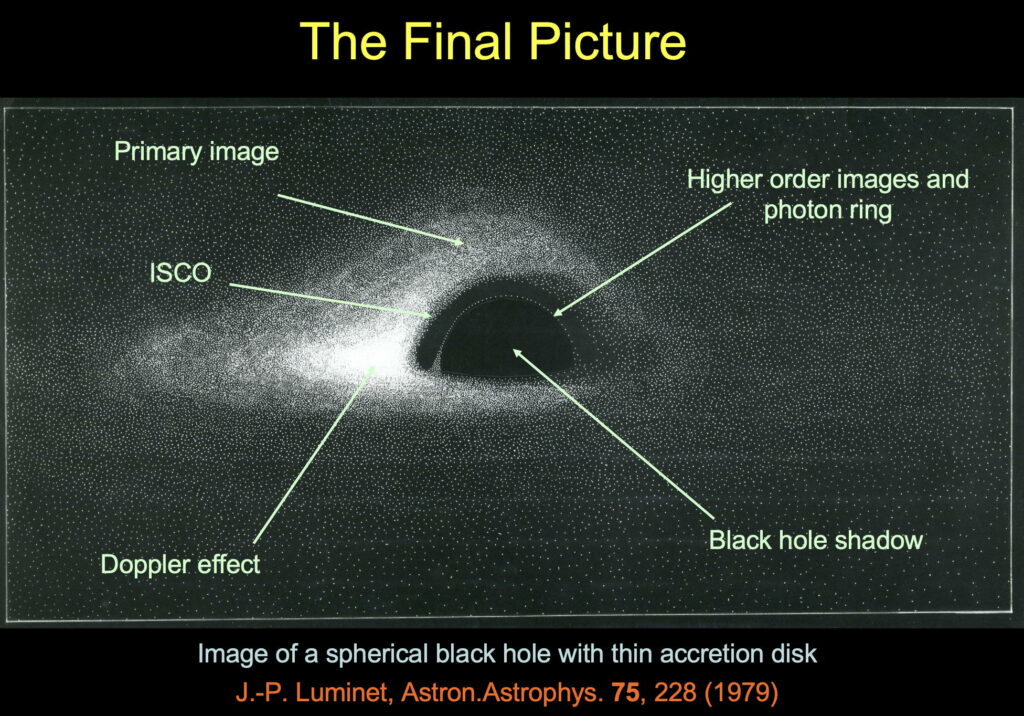
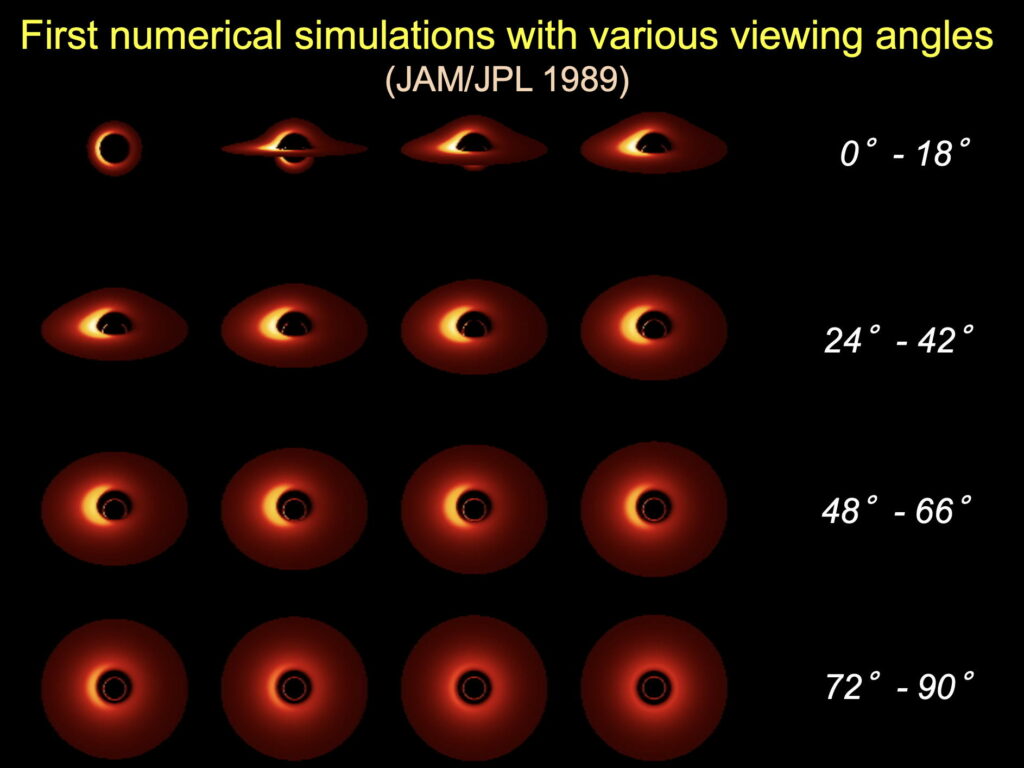
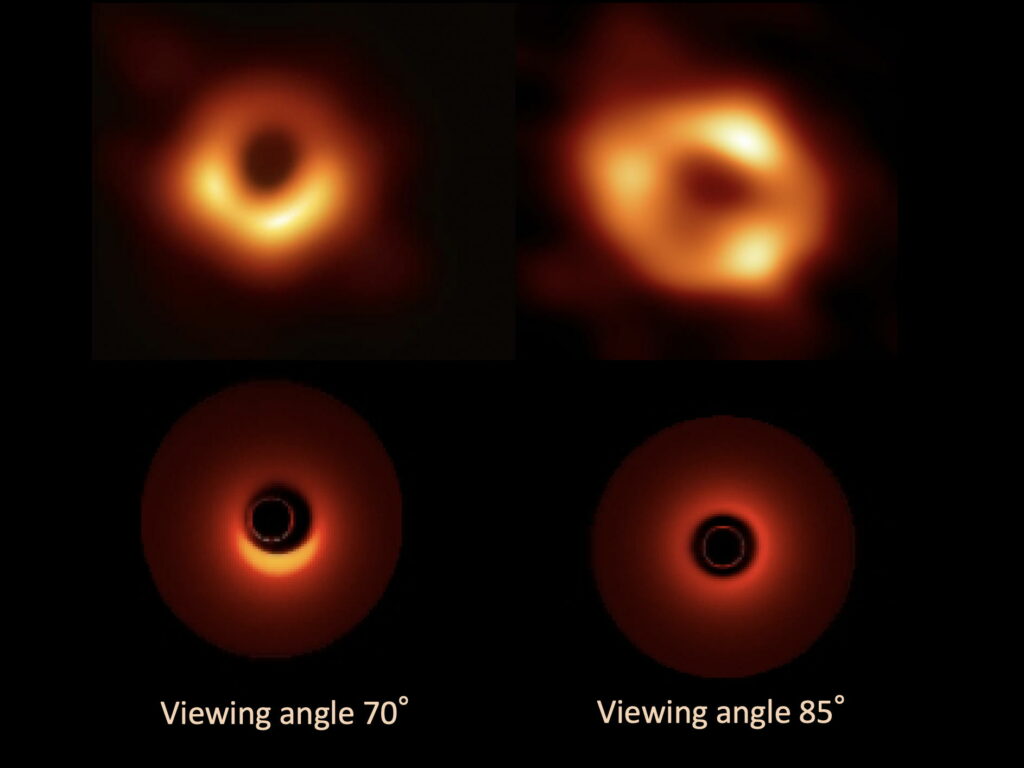
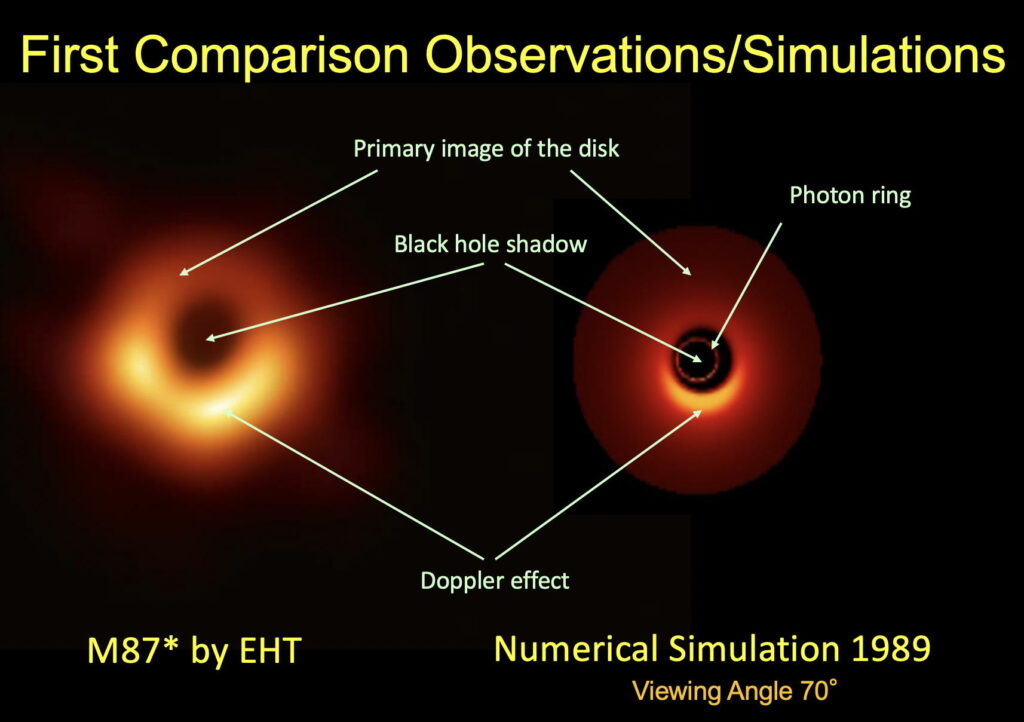
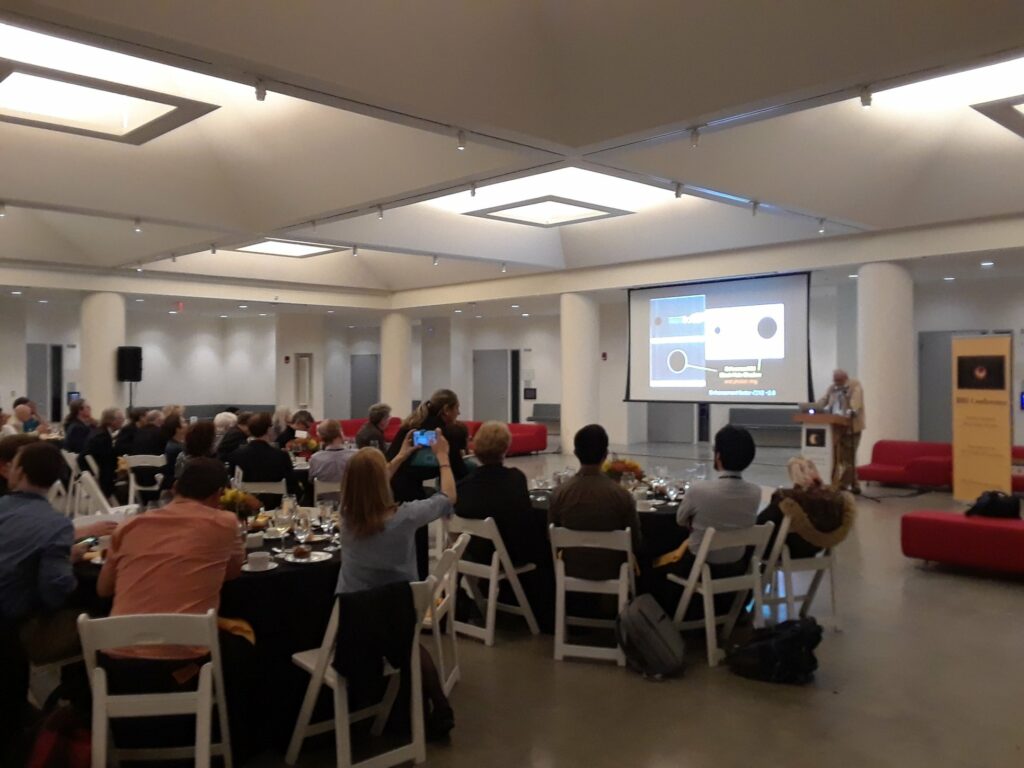
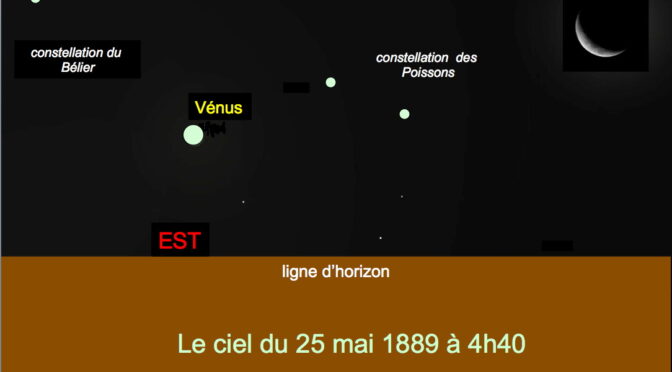
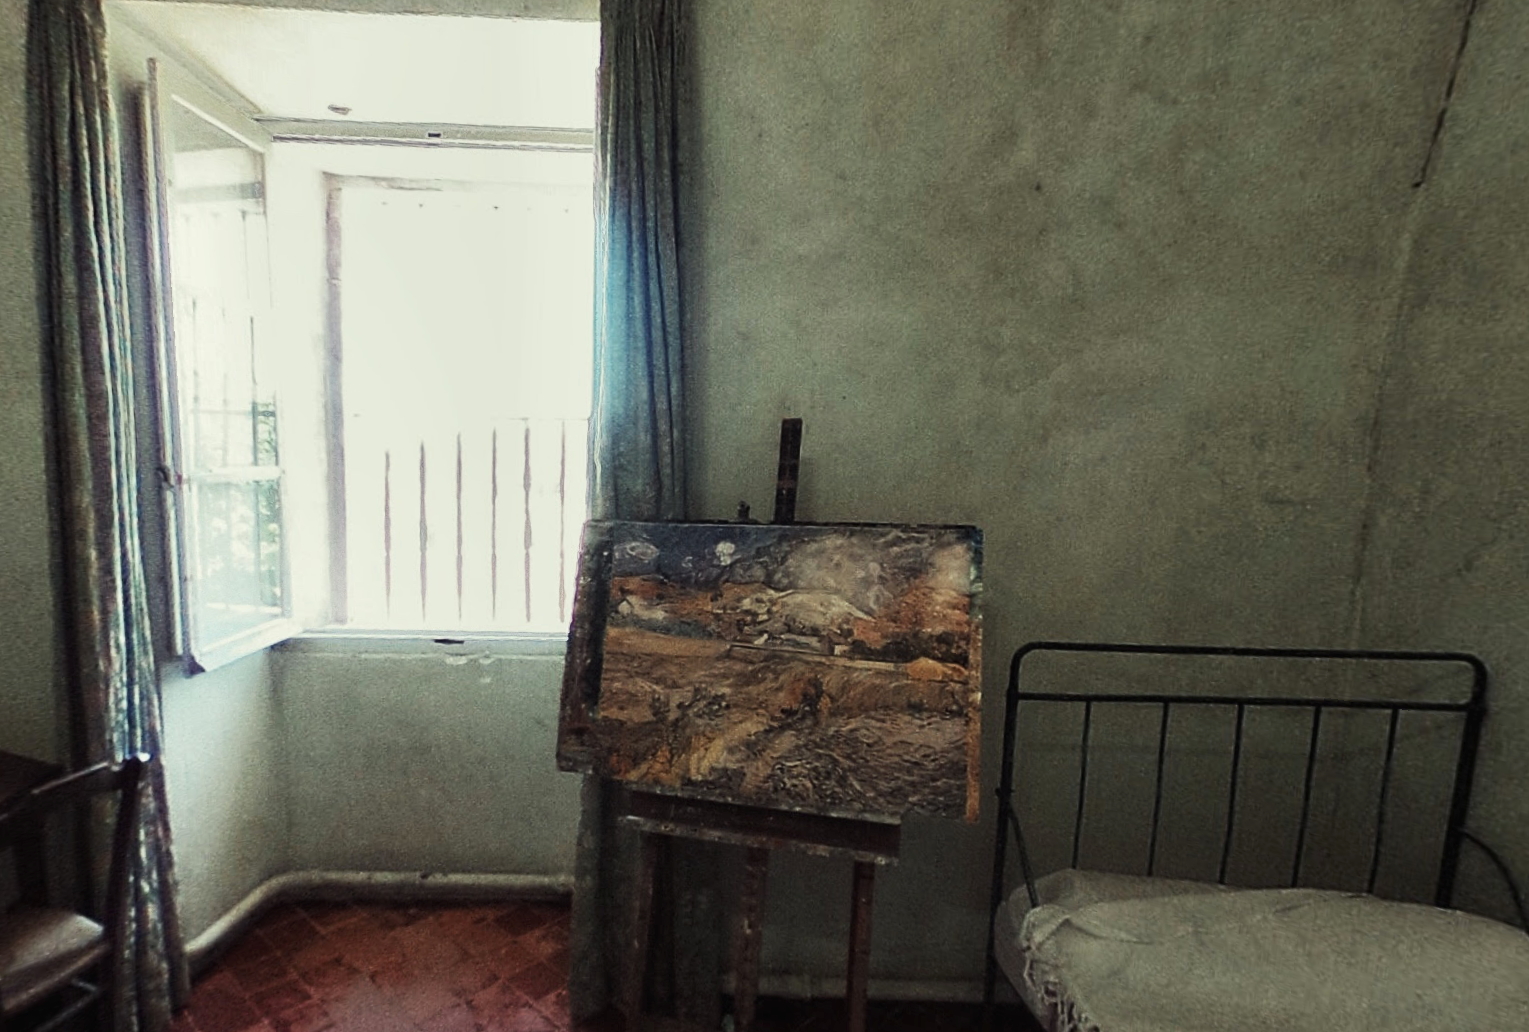


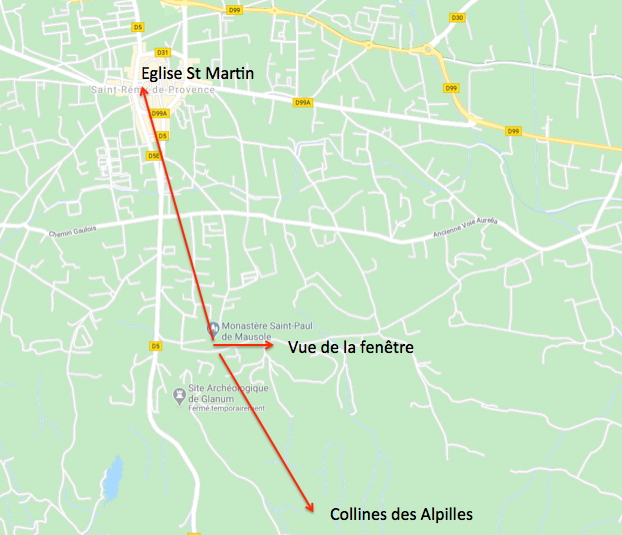

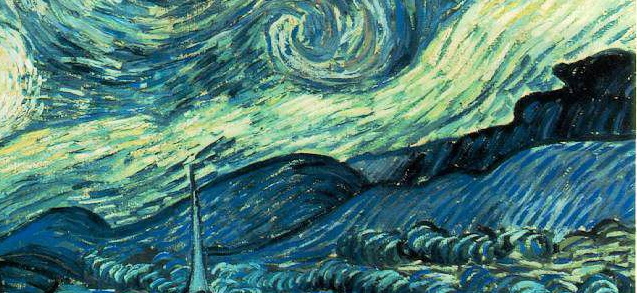
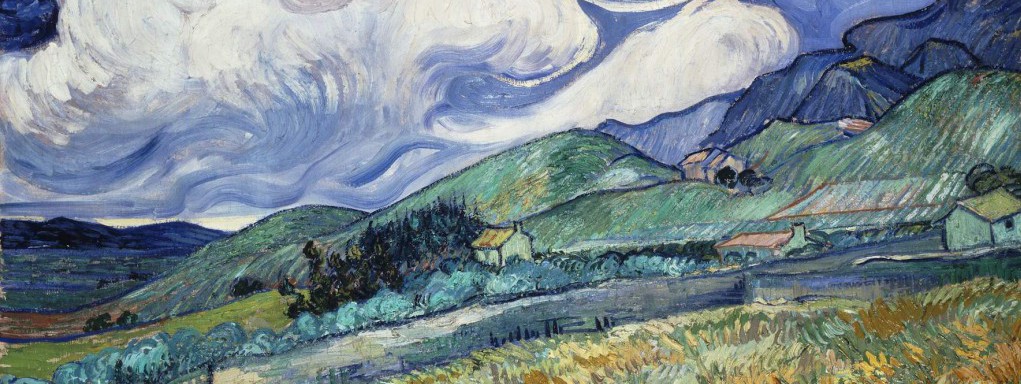
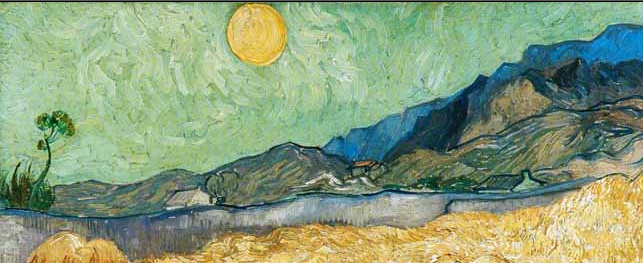

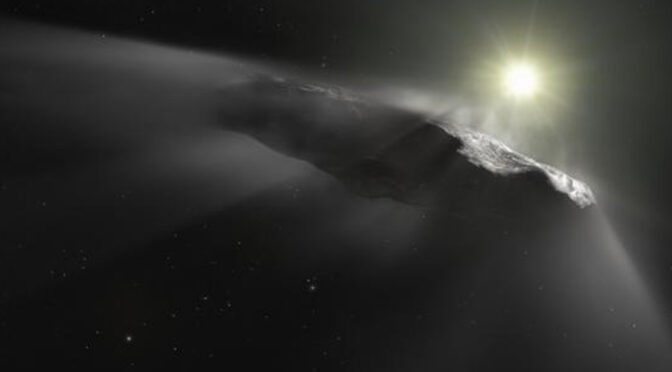
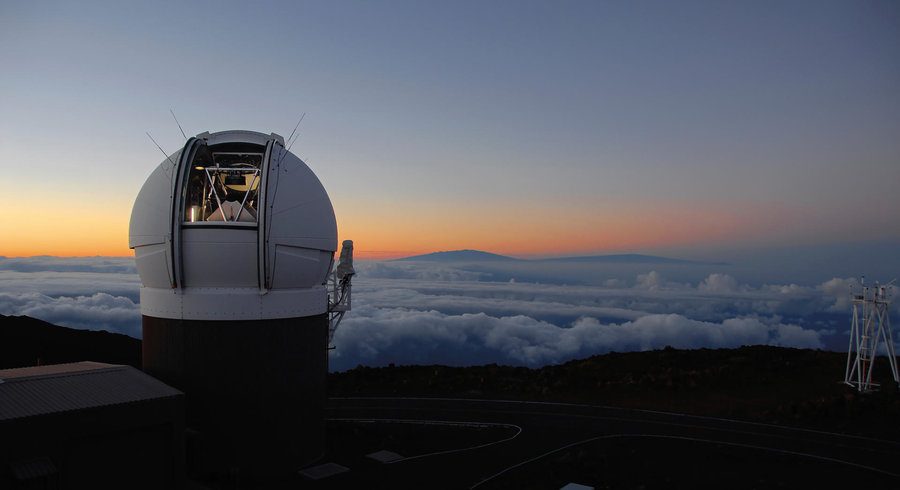
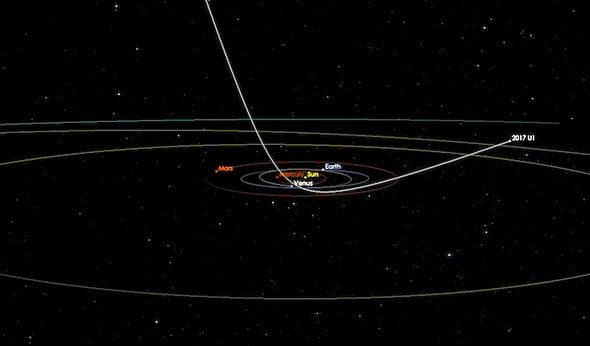
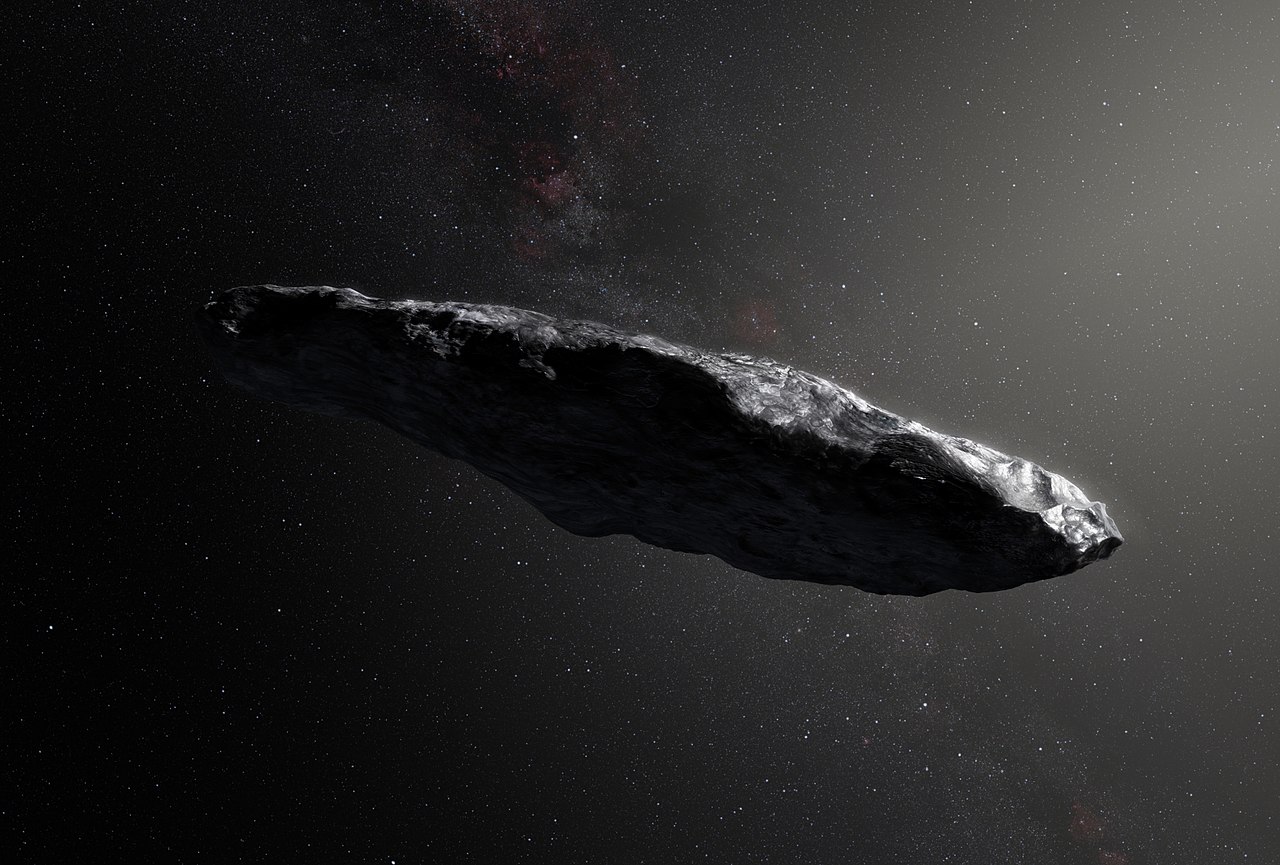
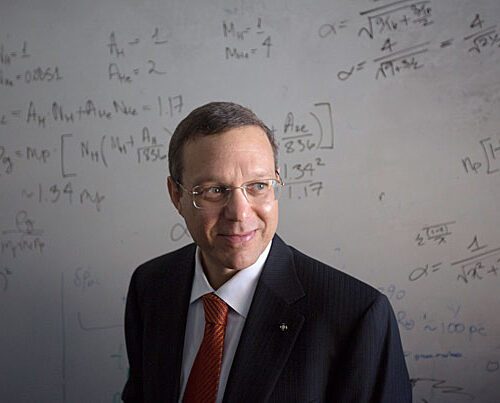
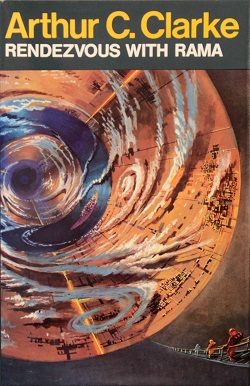
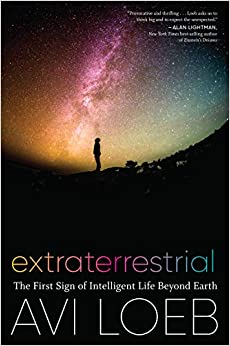
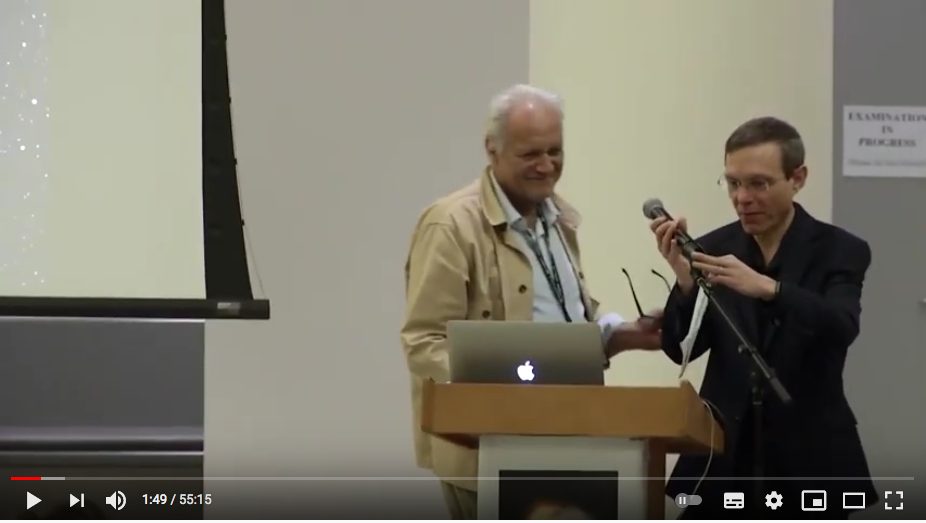

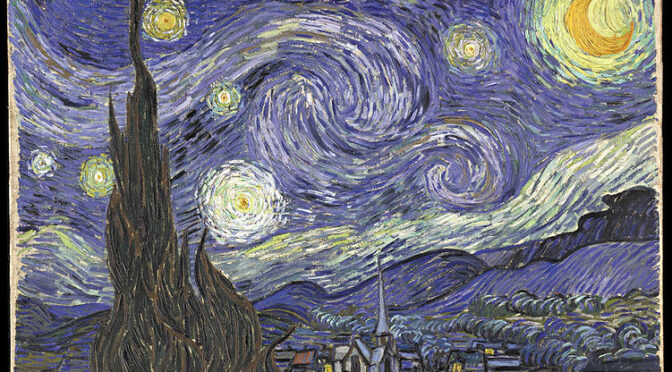
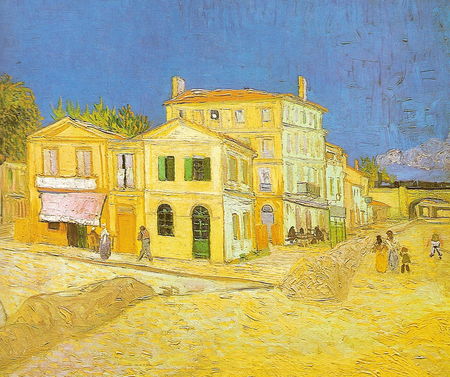
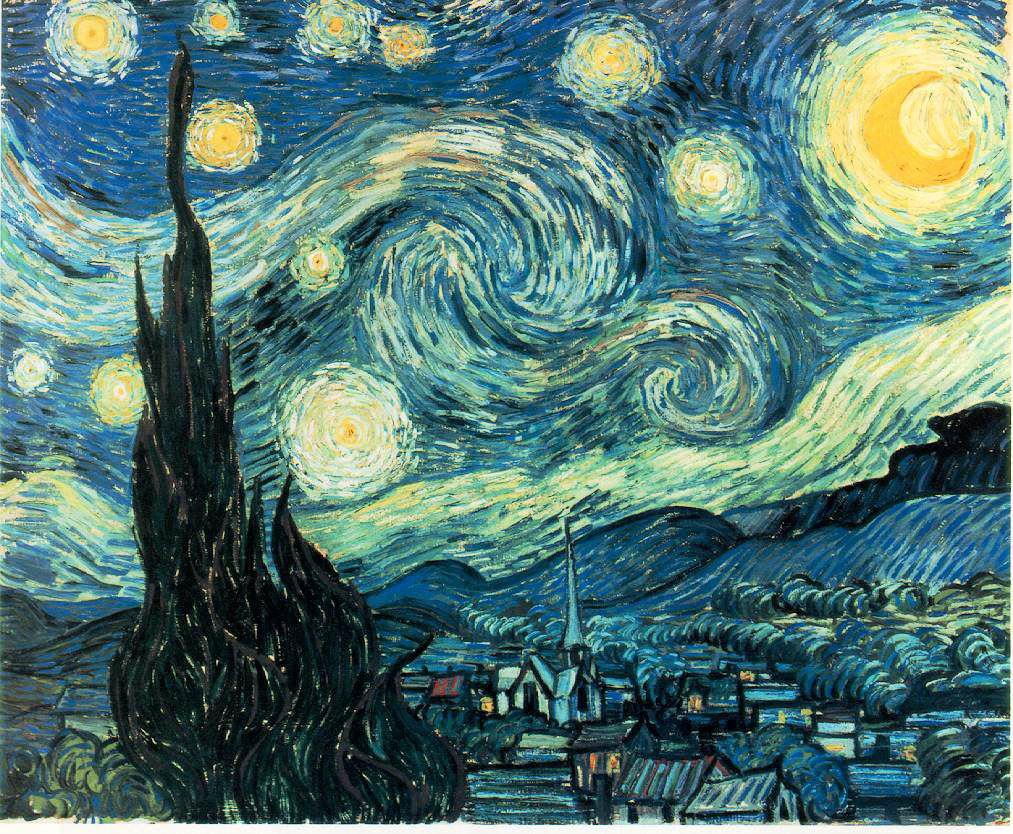
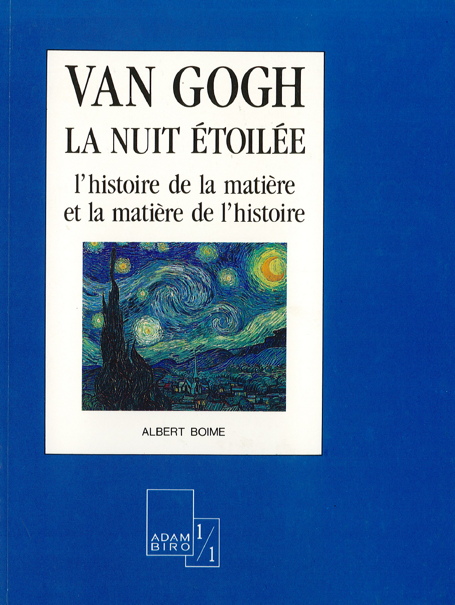
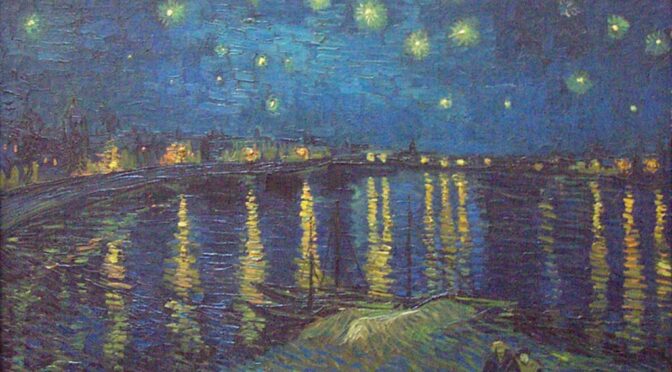
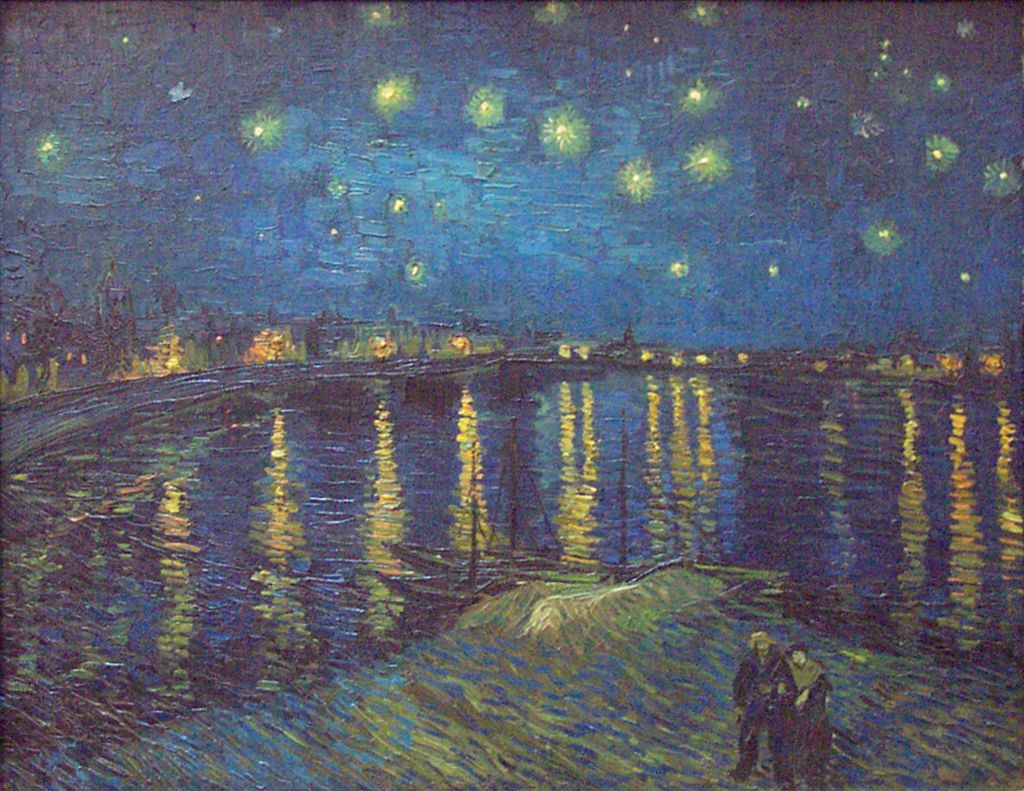
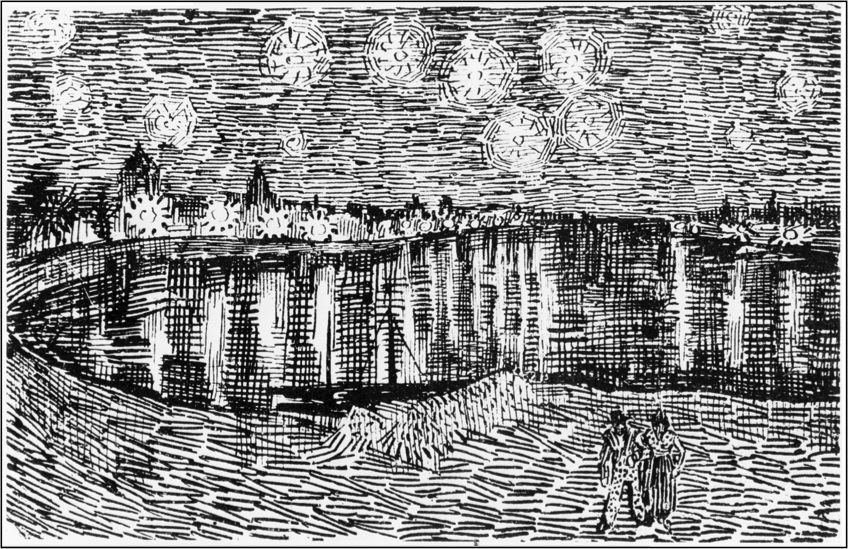
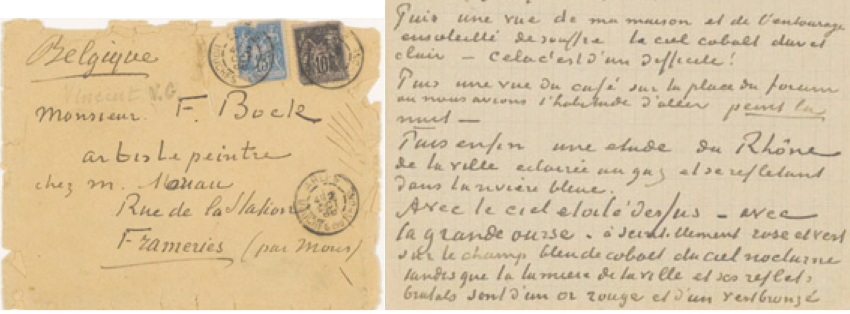
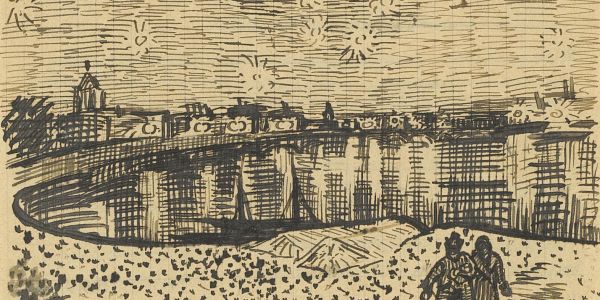

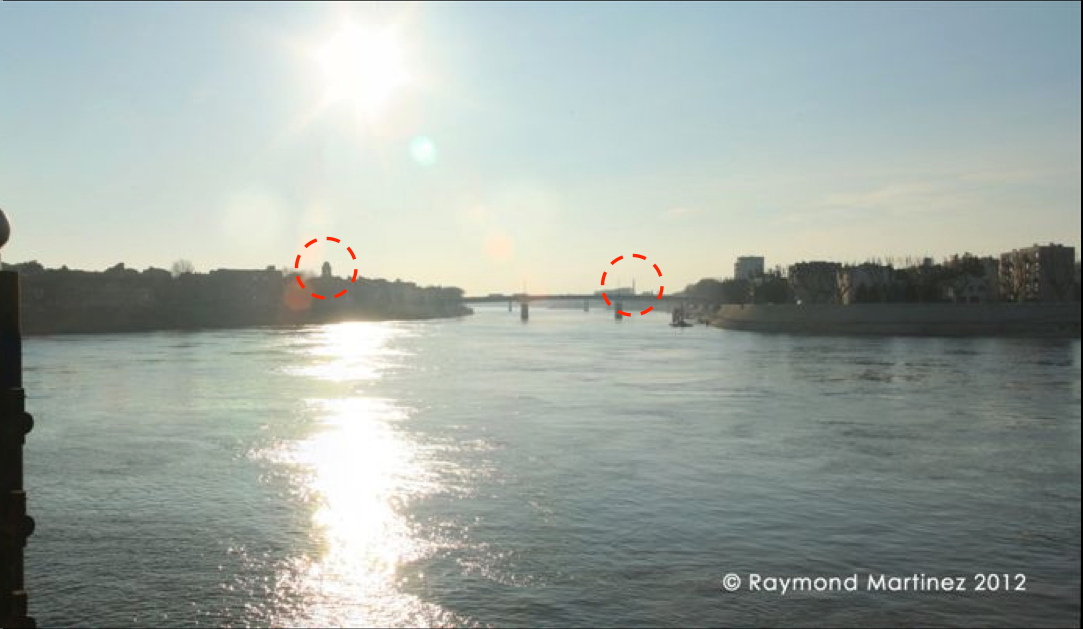
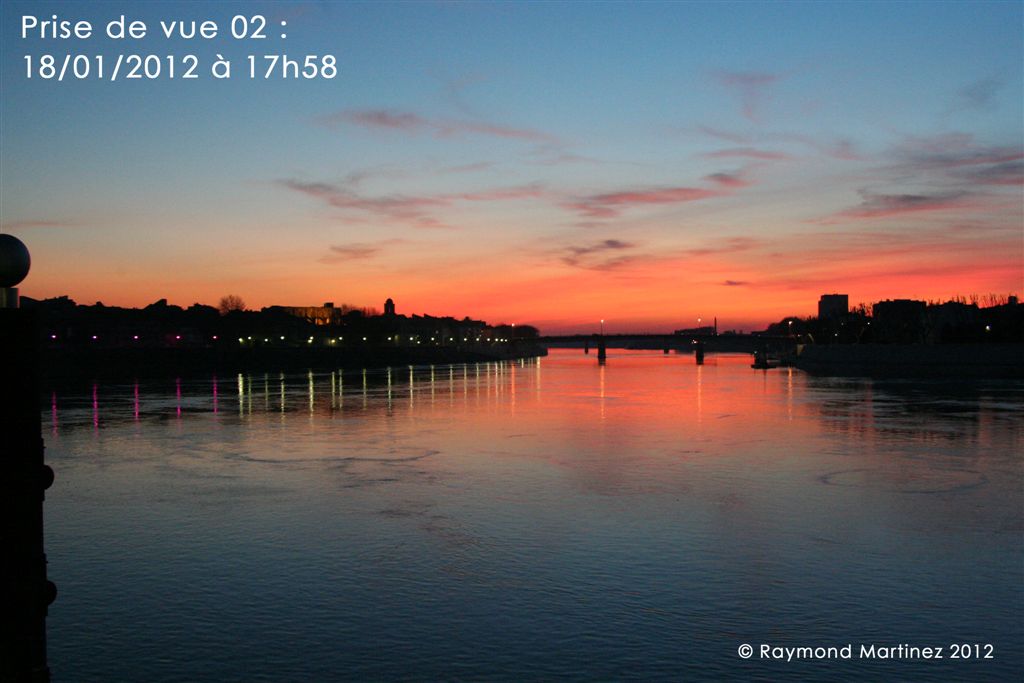
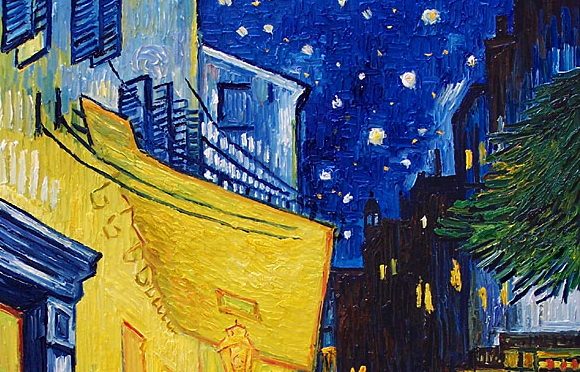

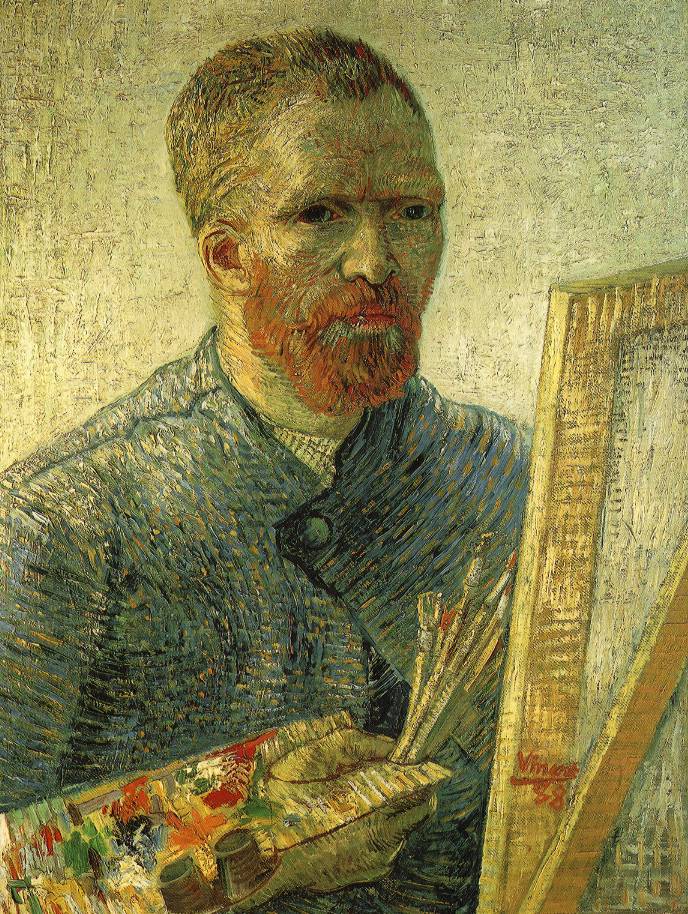


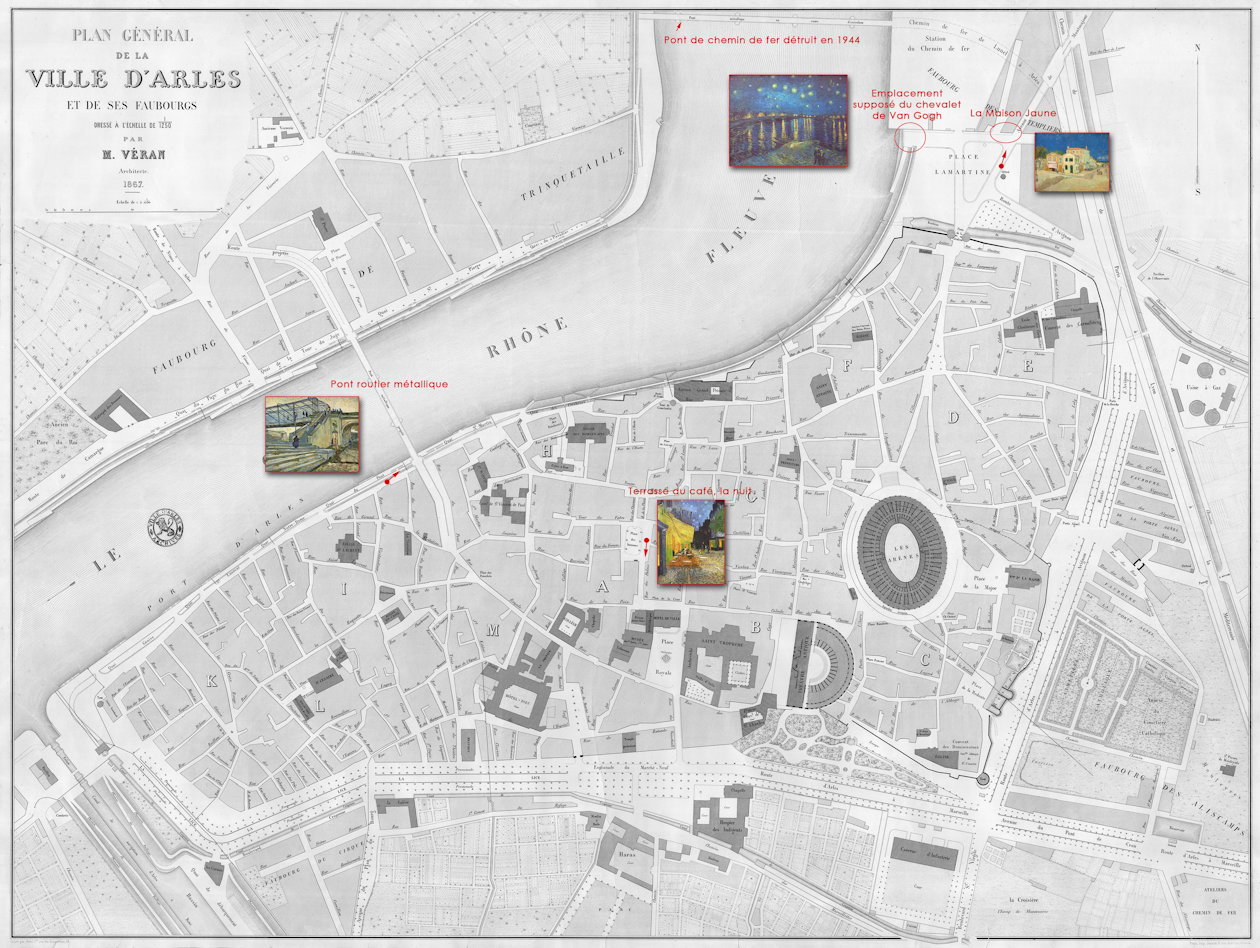
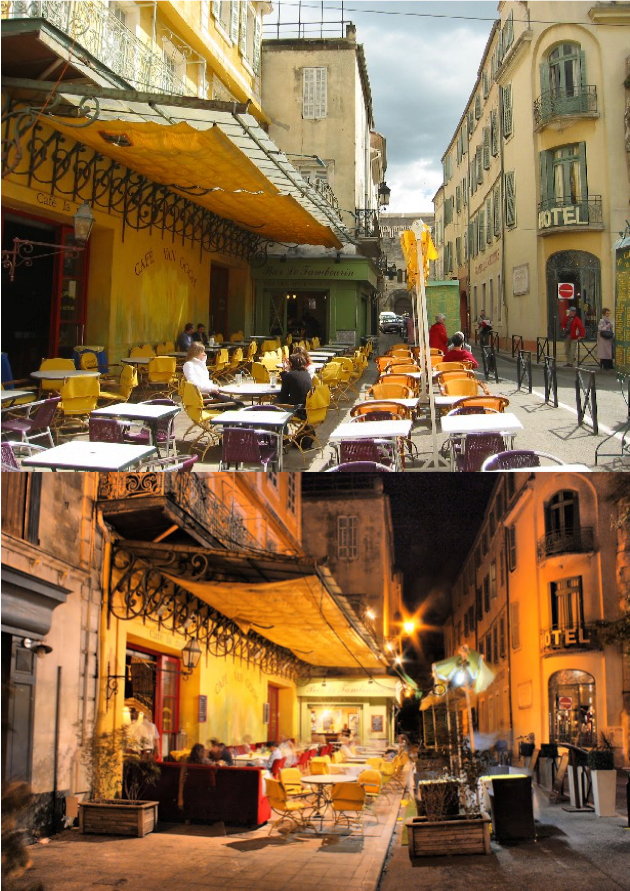
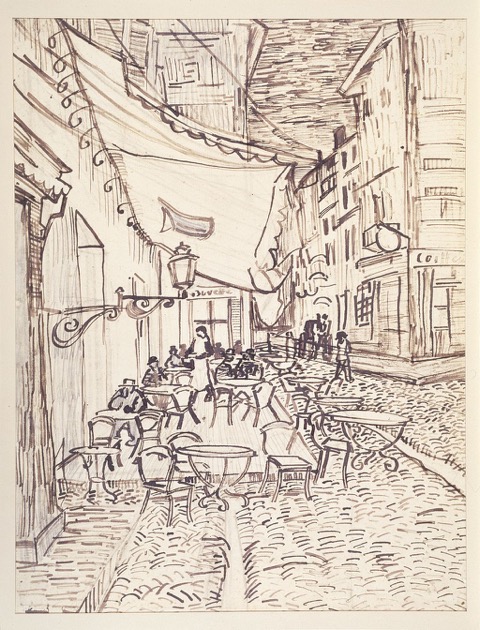
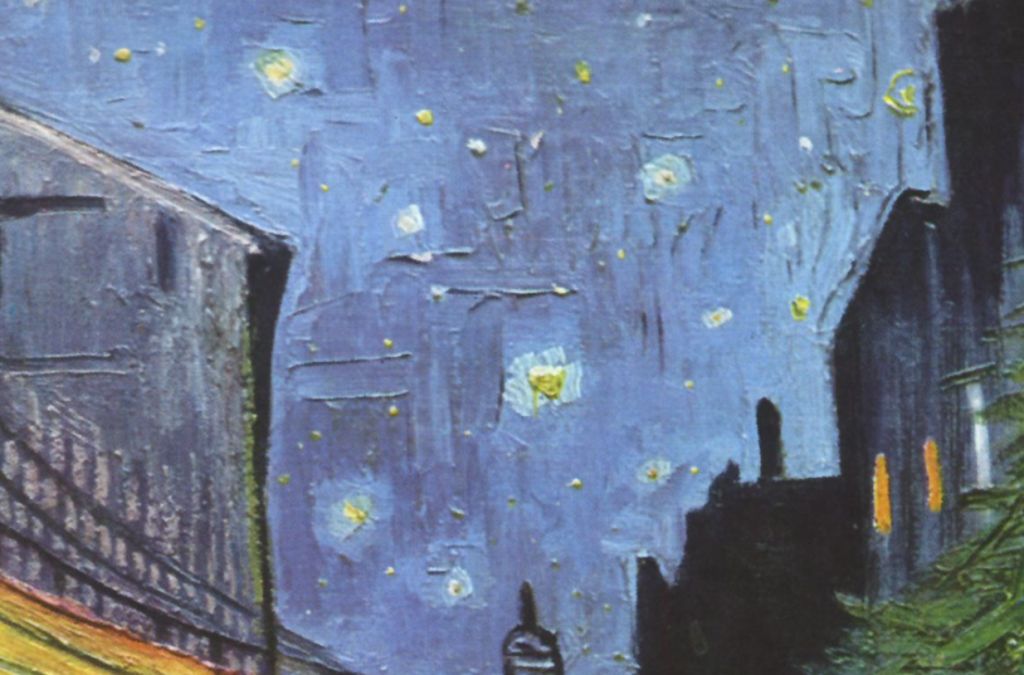

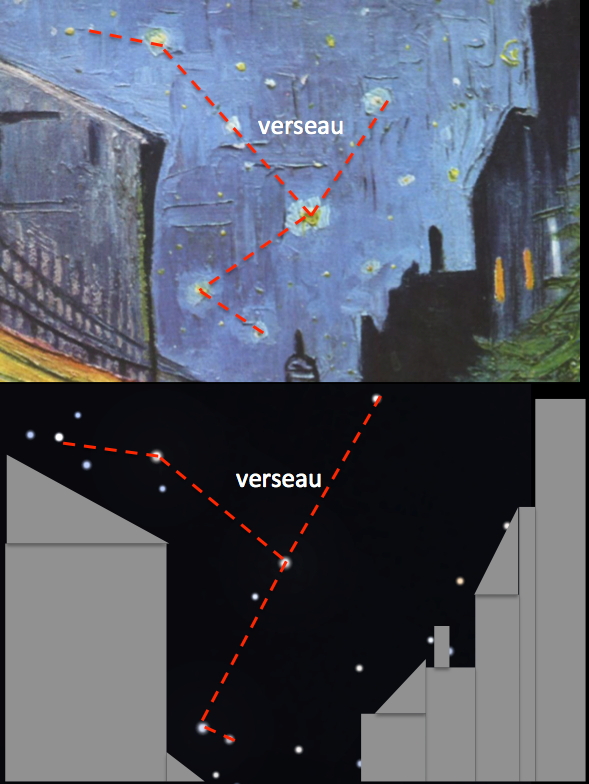
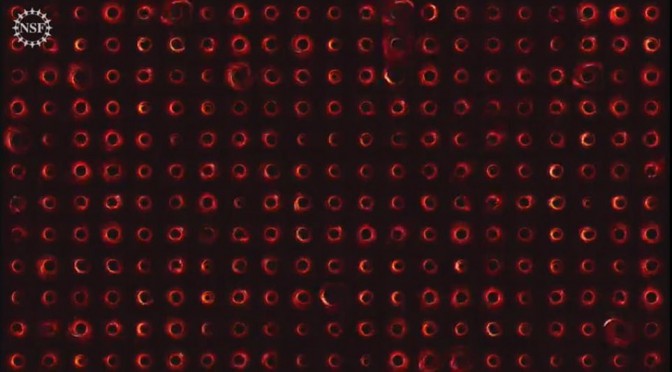
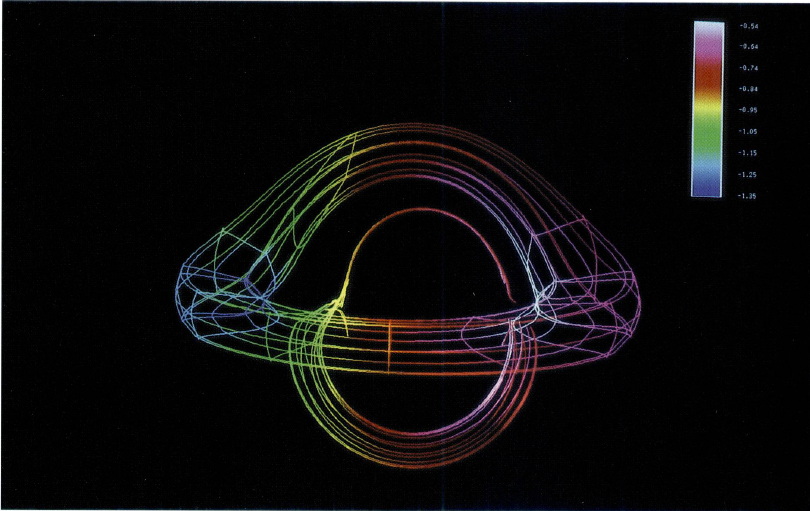
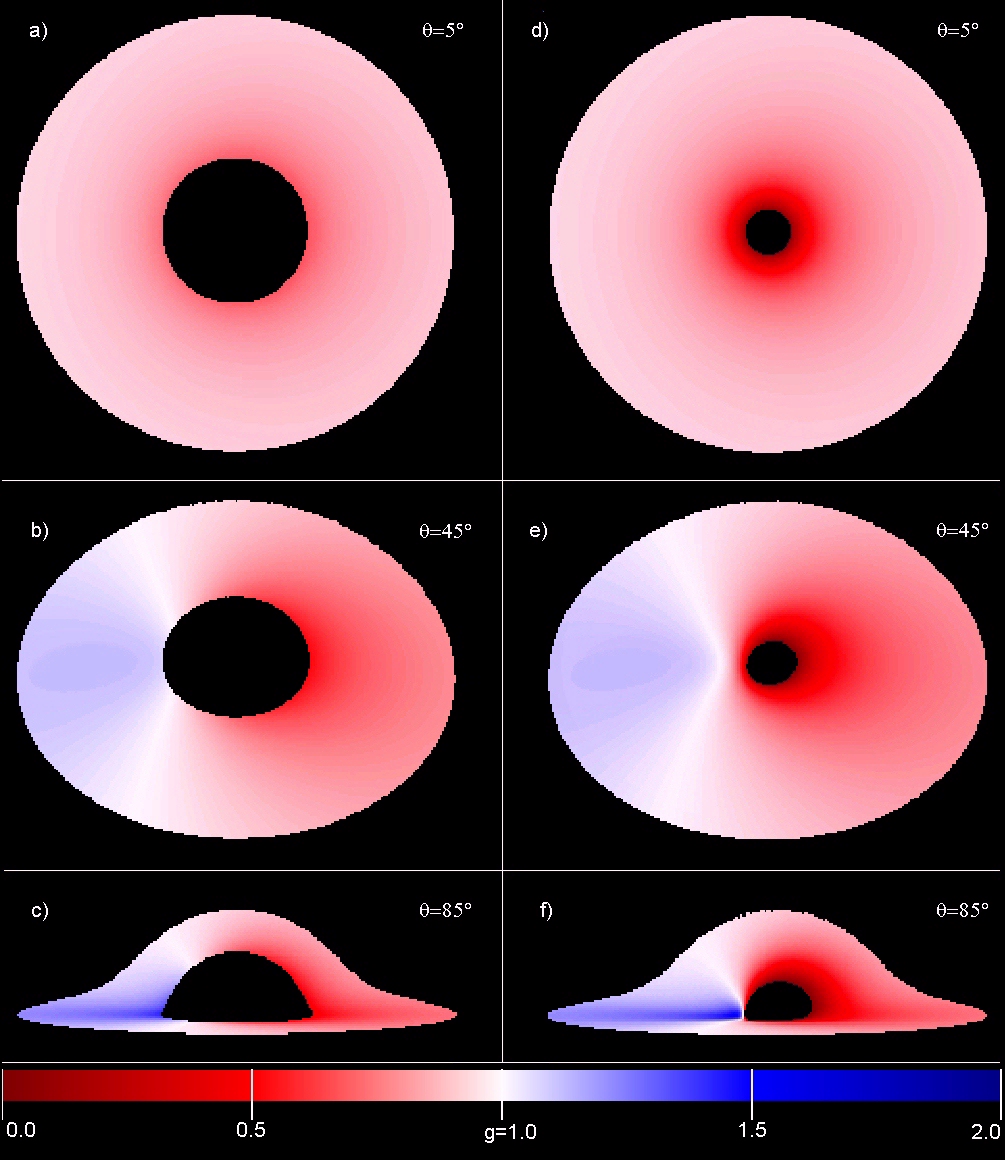
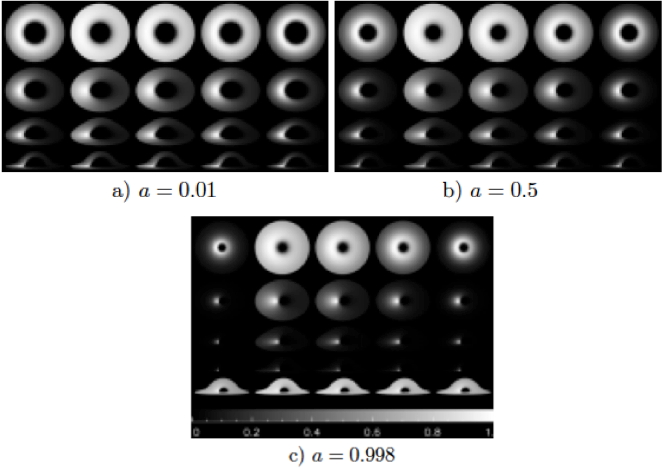
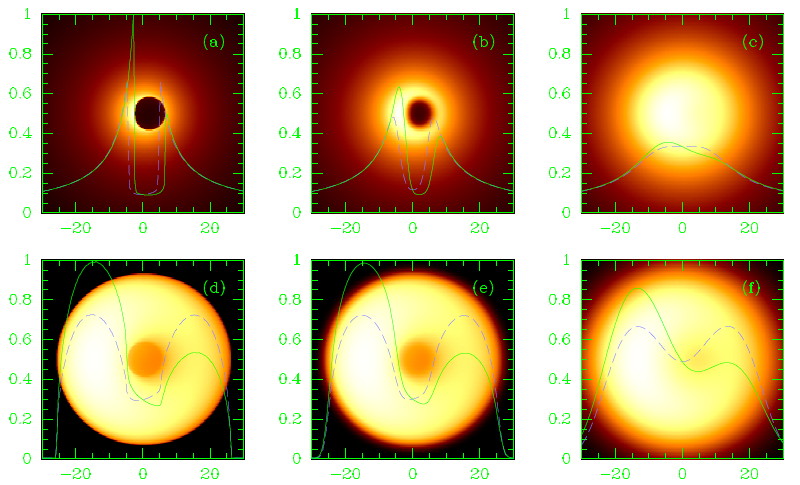
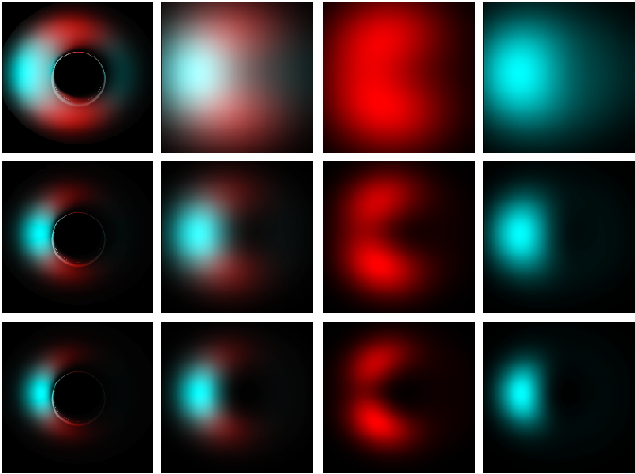
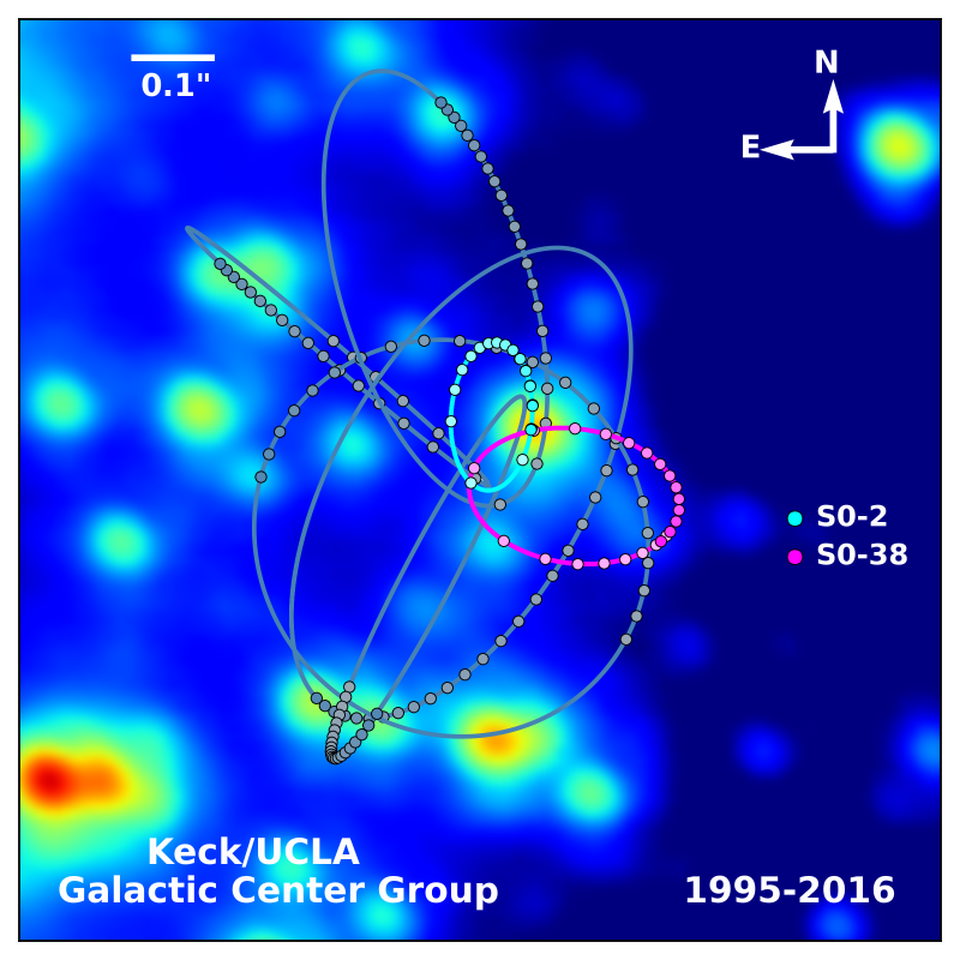
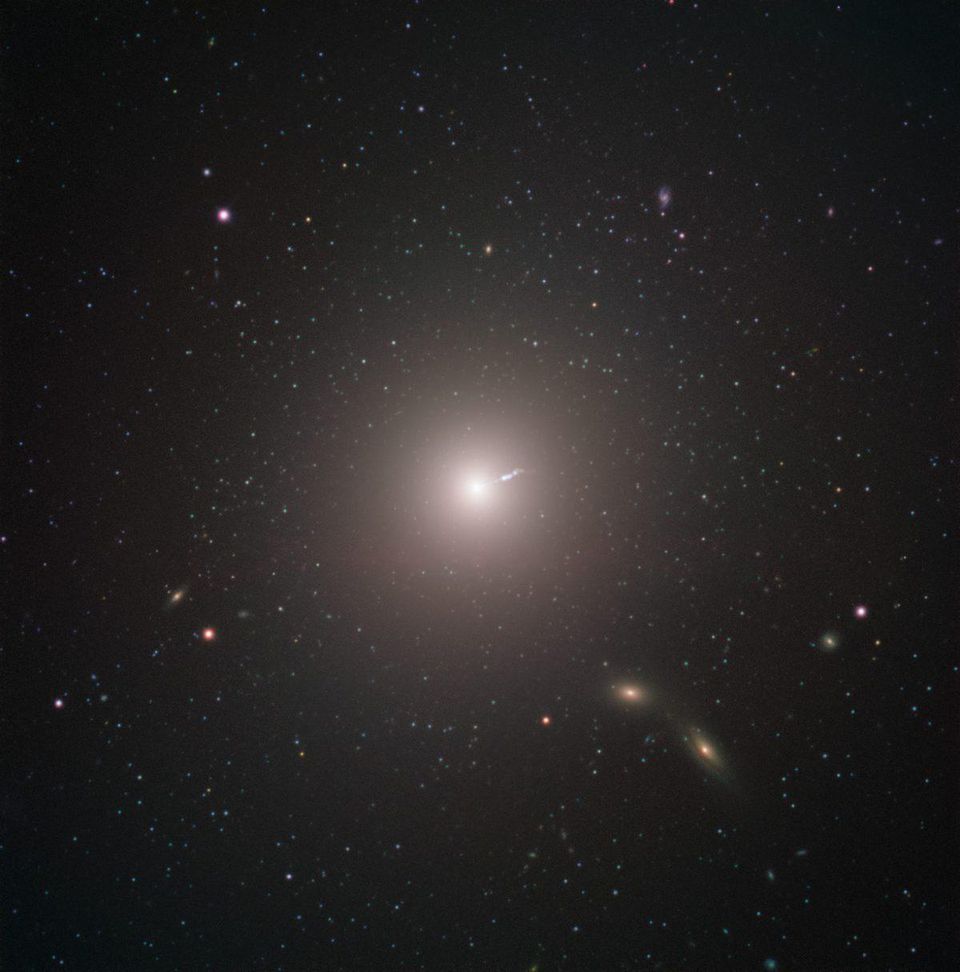
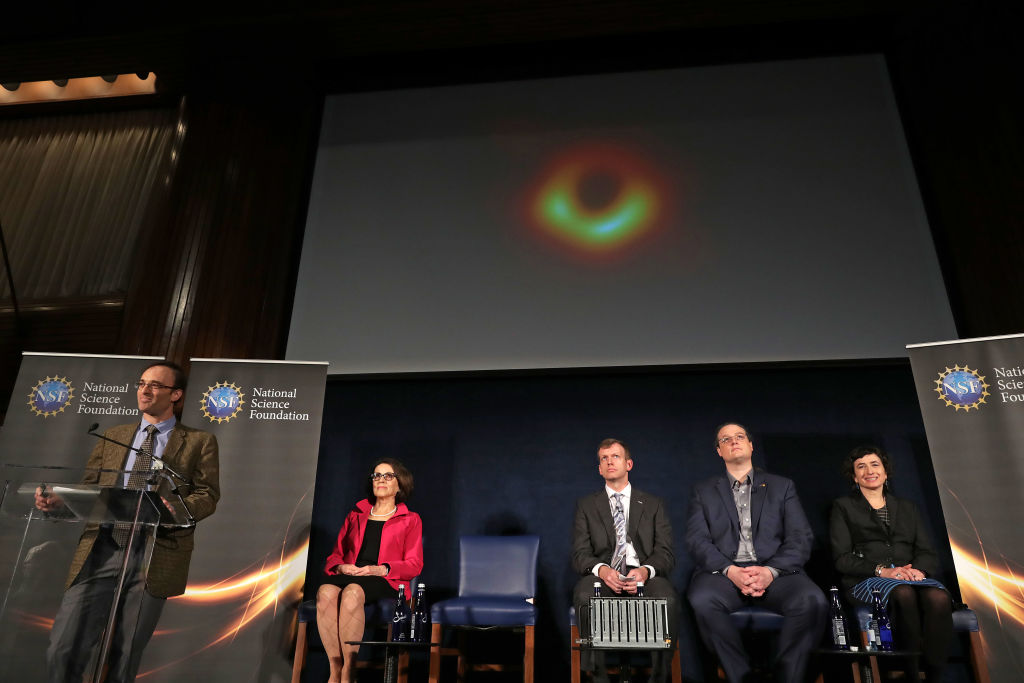
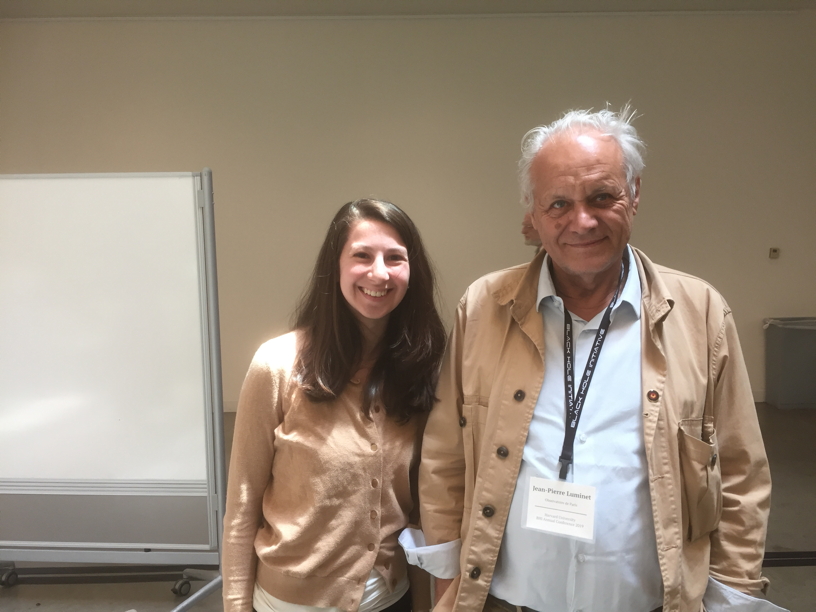
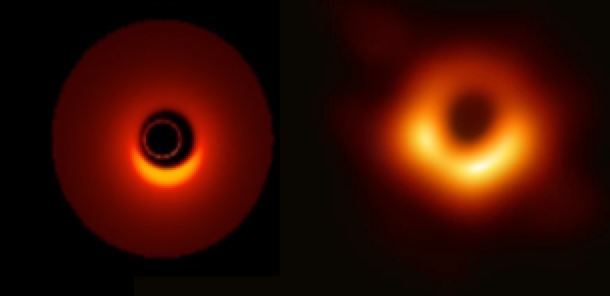
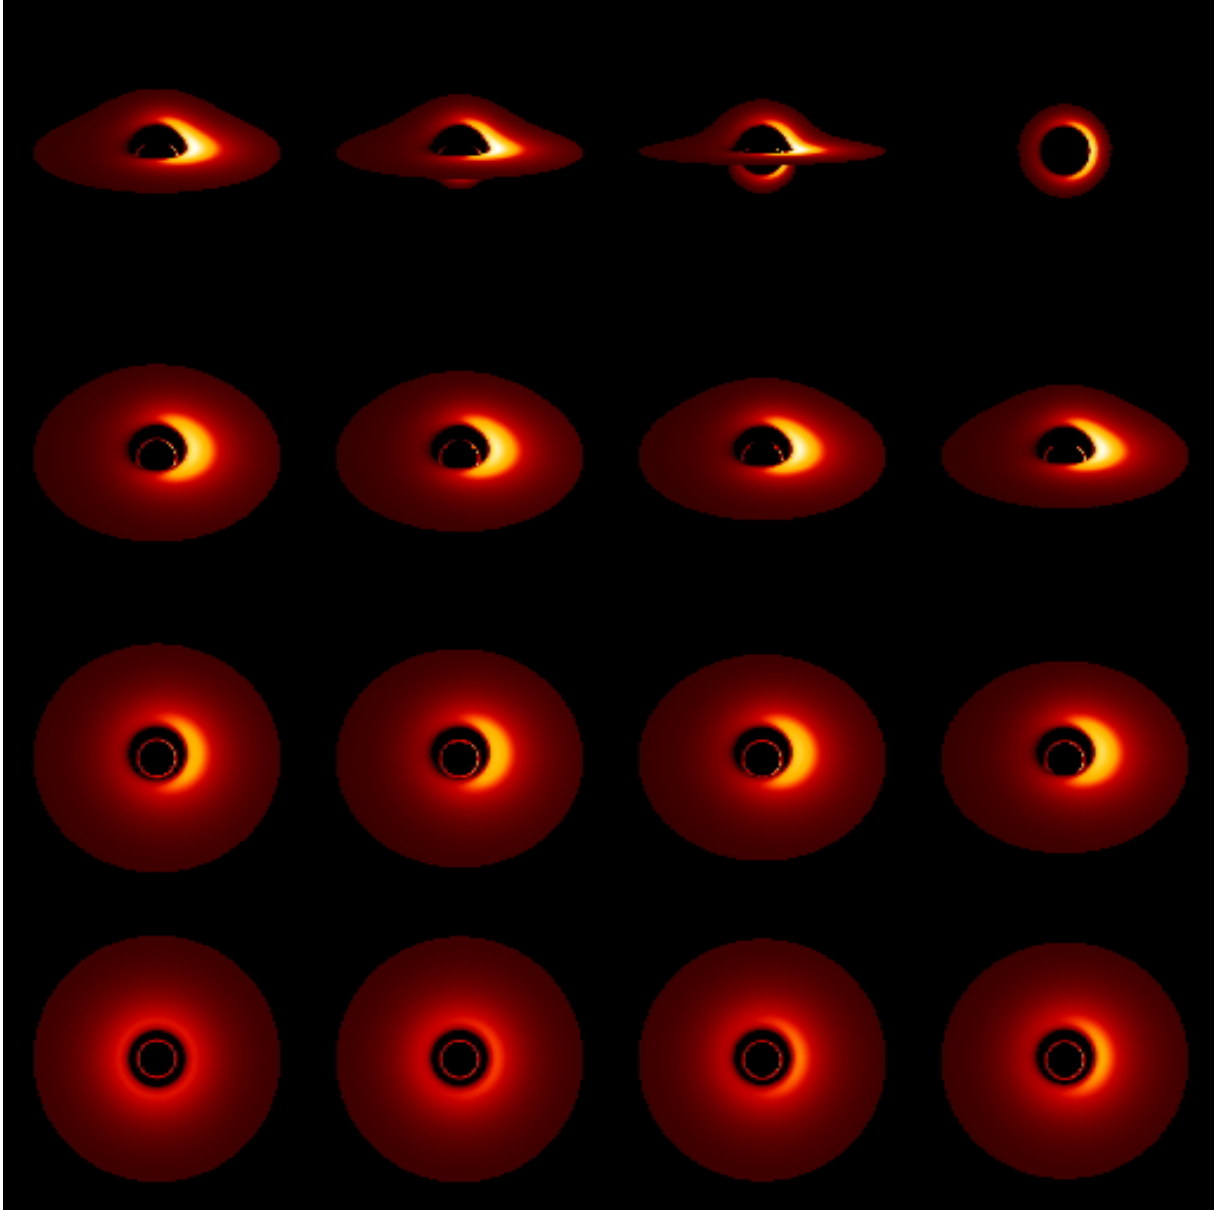
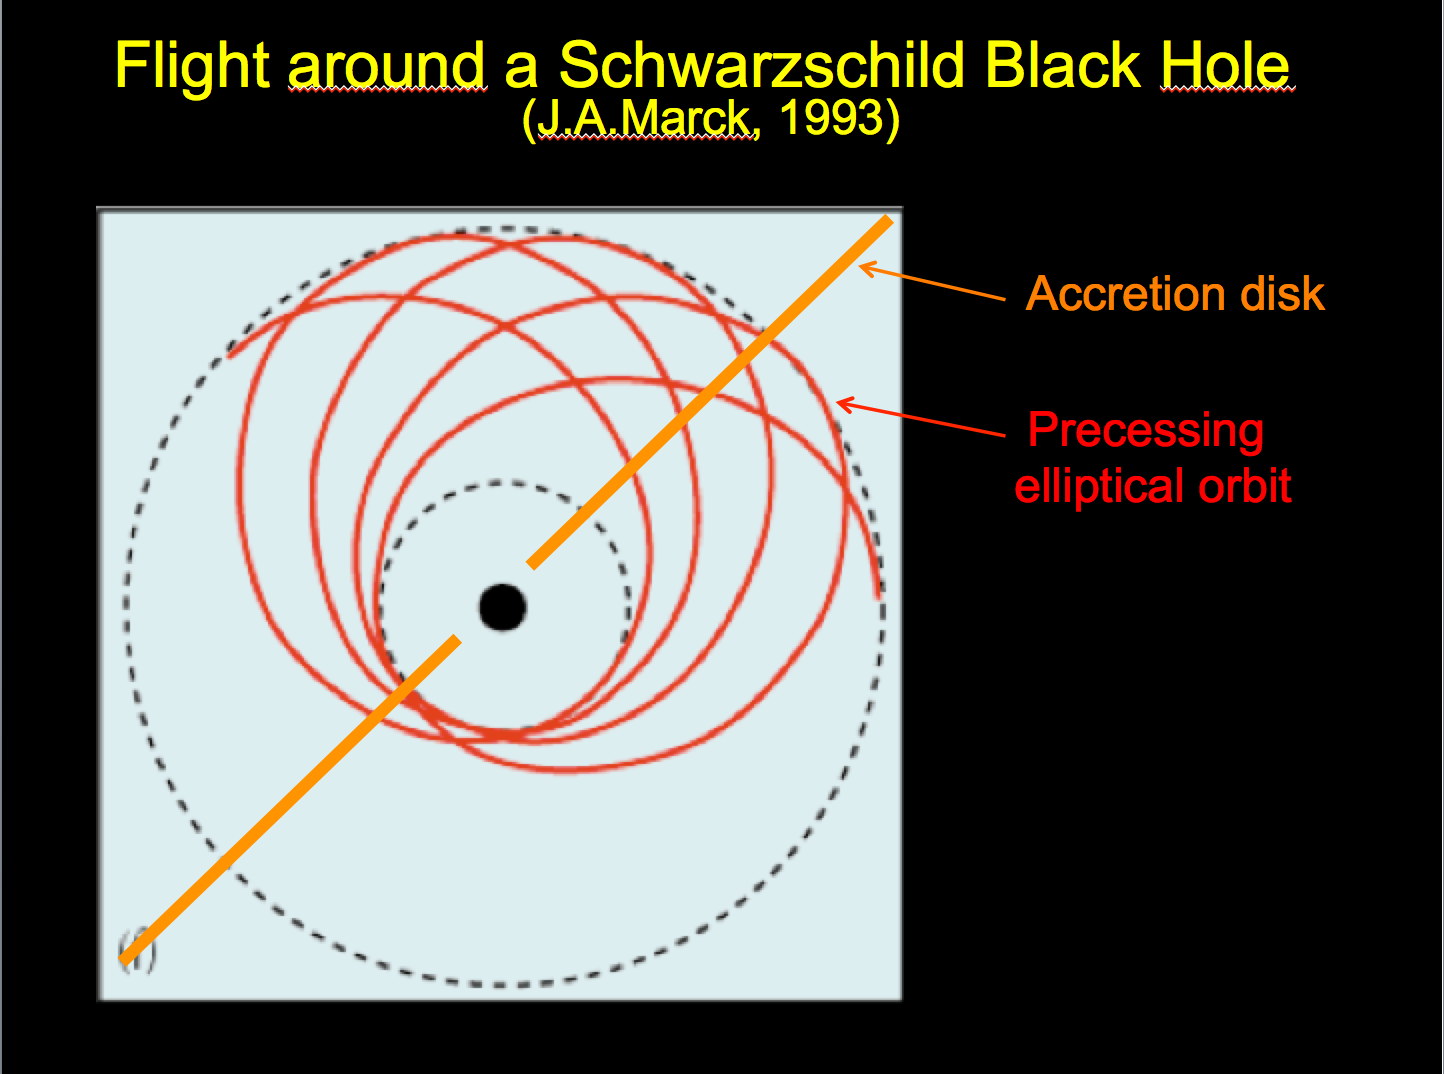
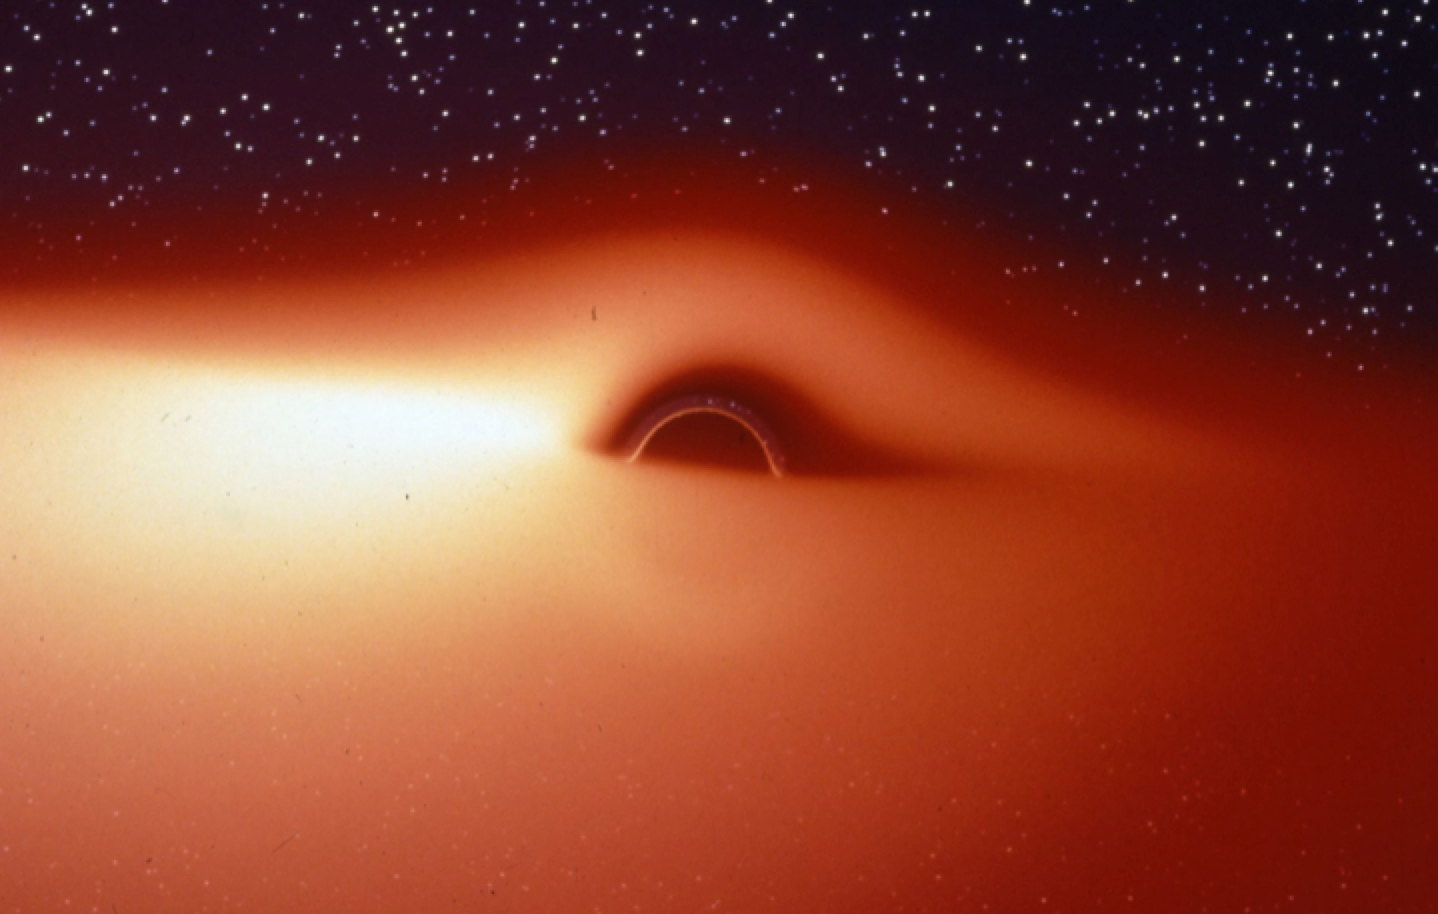
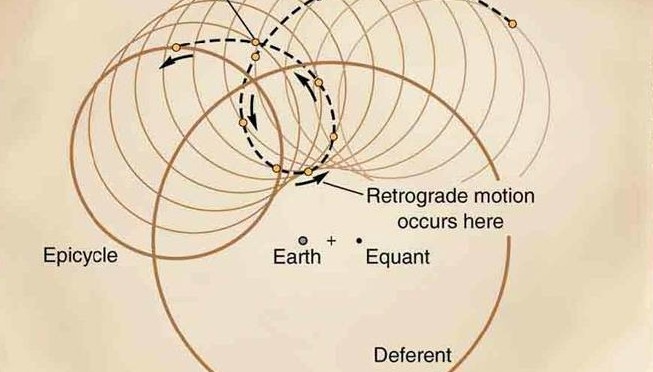
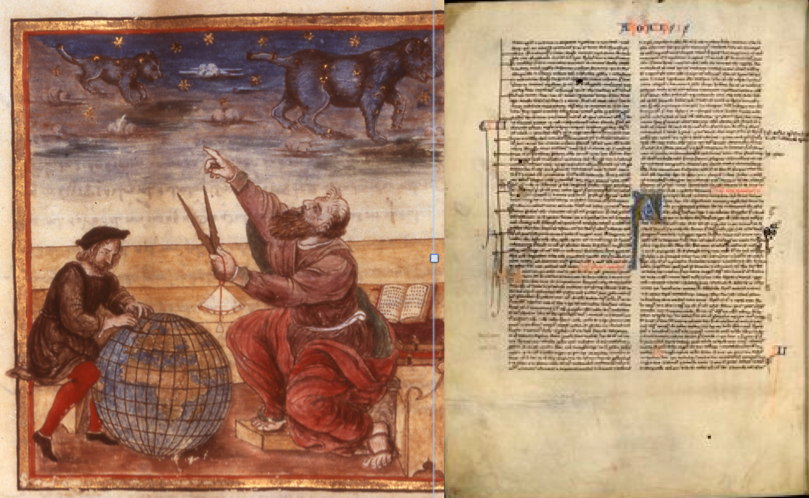
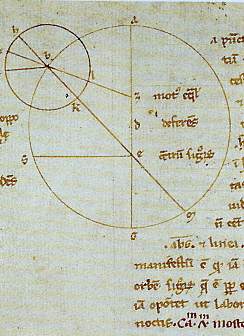
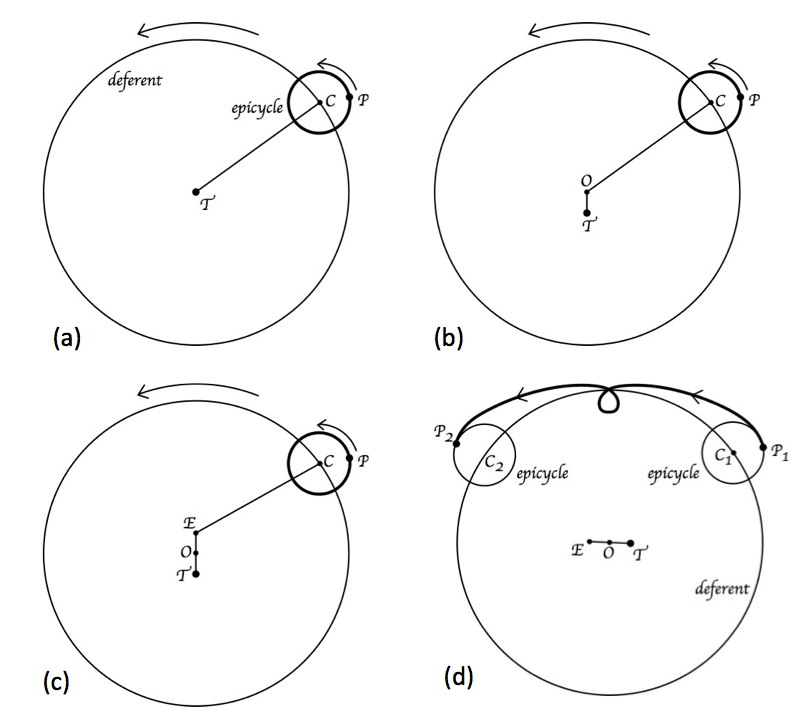
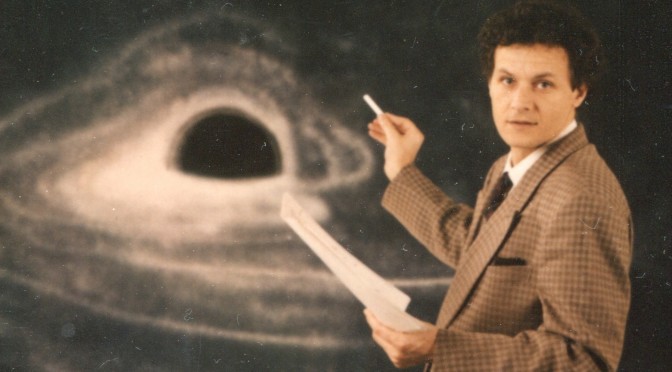
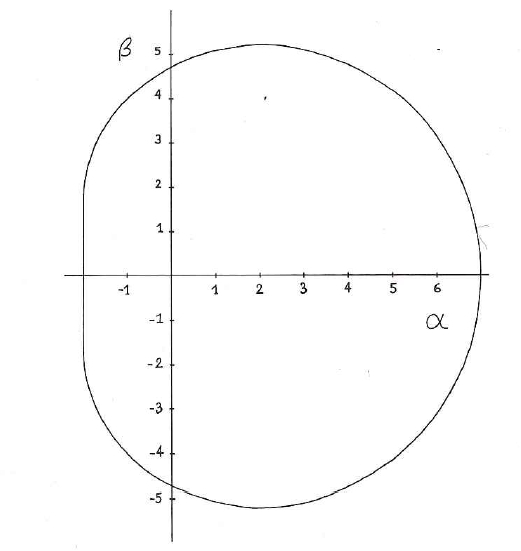
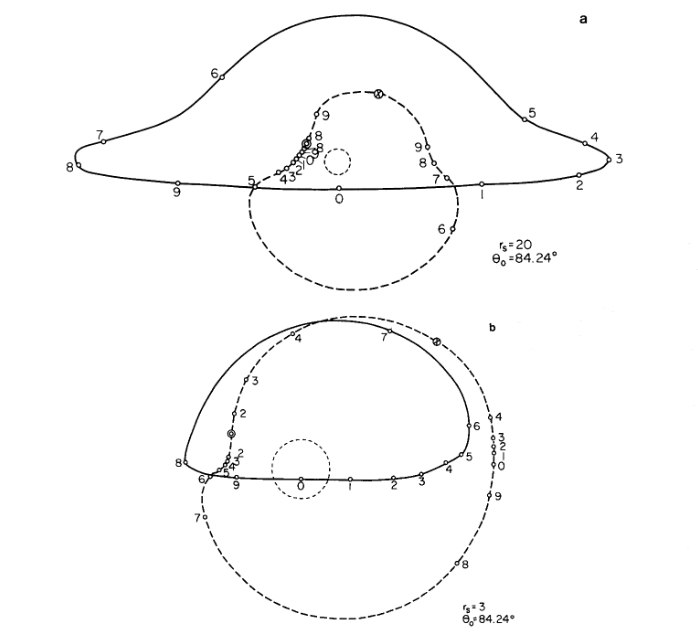
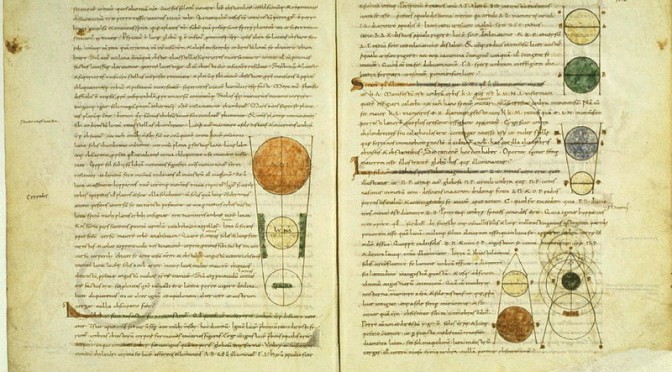
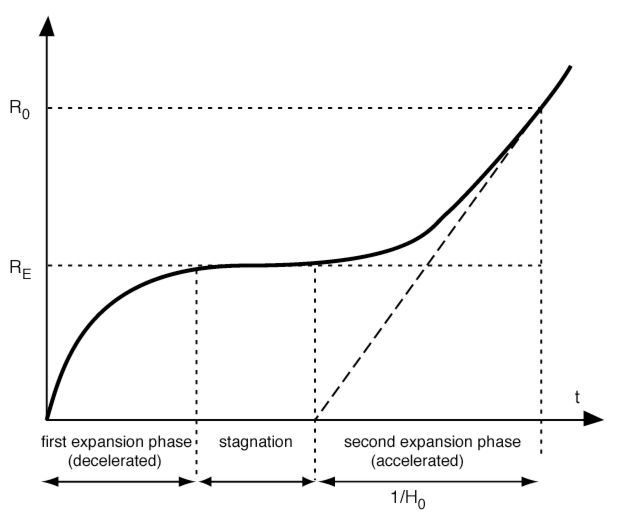
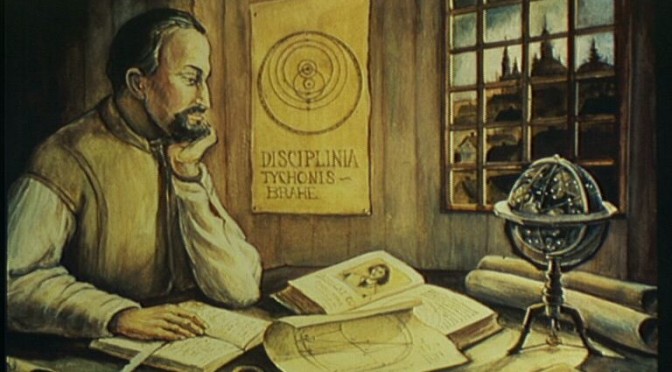
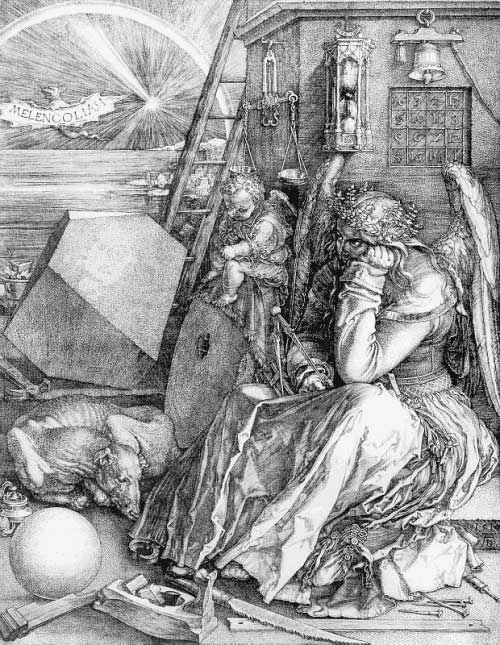
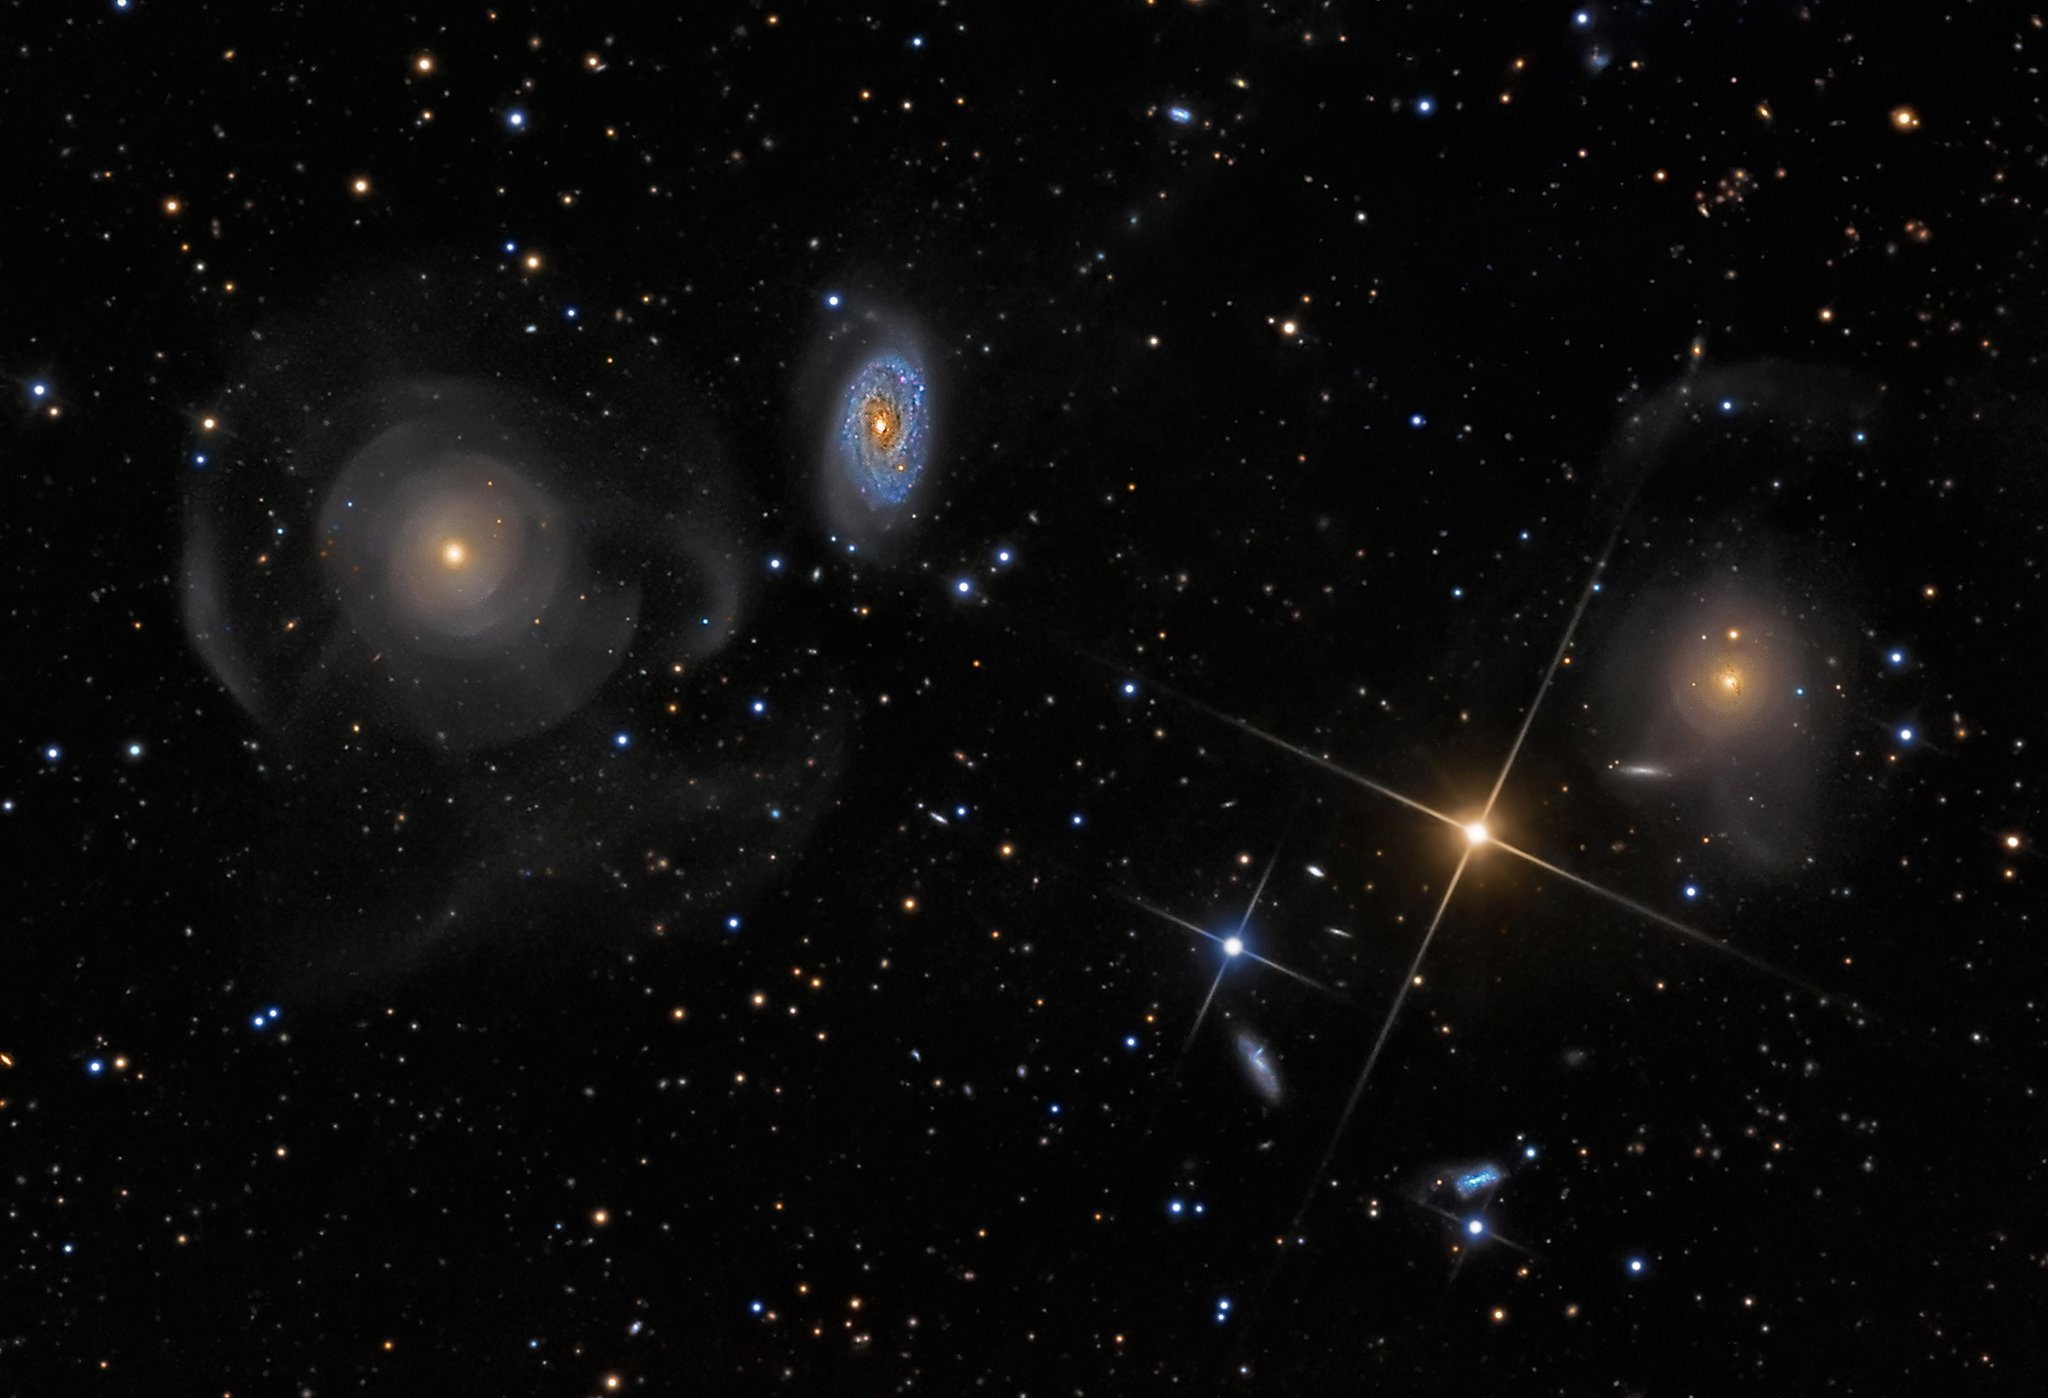
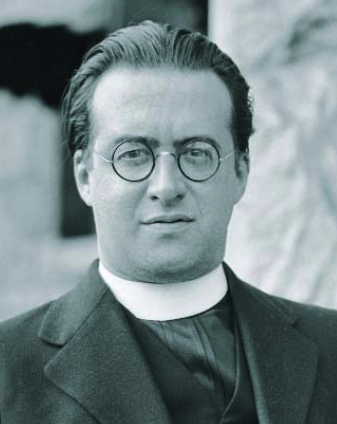
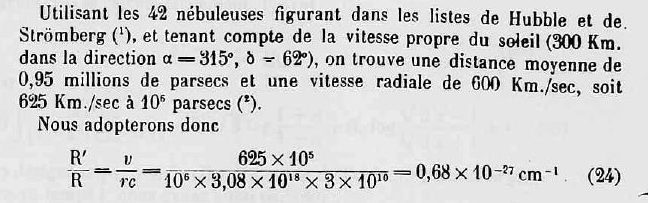
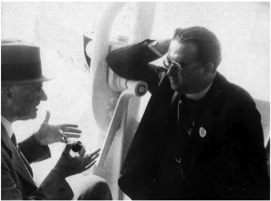

 This post is an adaptation of a chapter of my book “
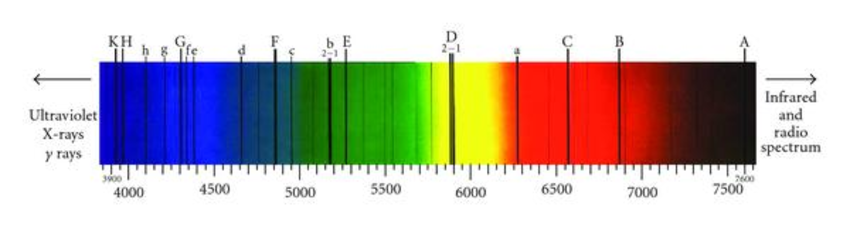
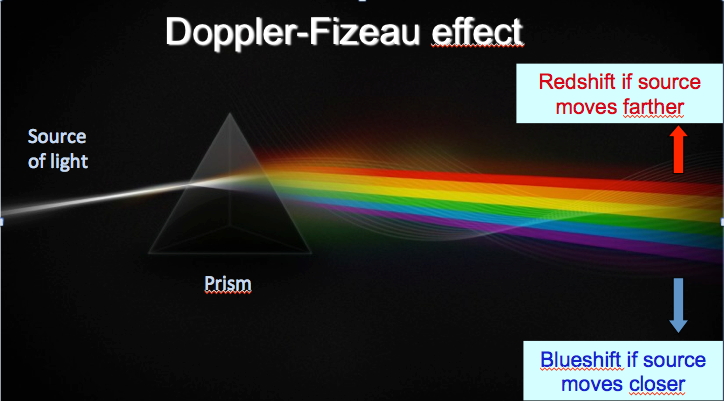
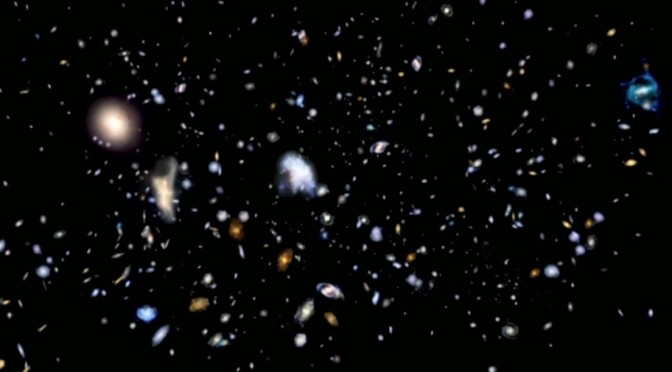
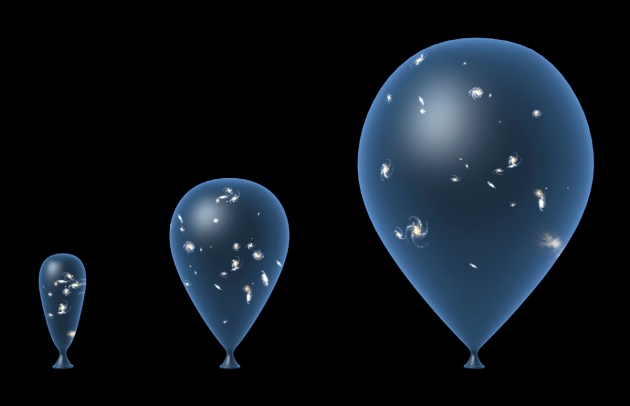
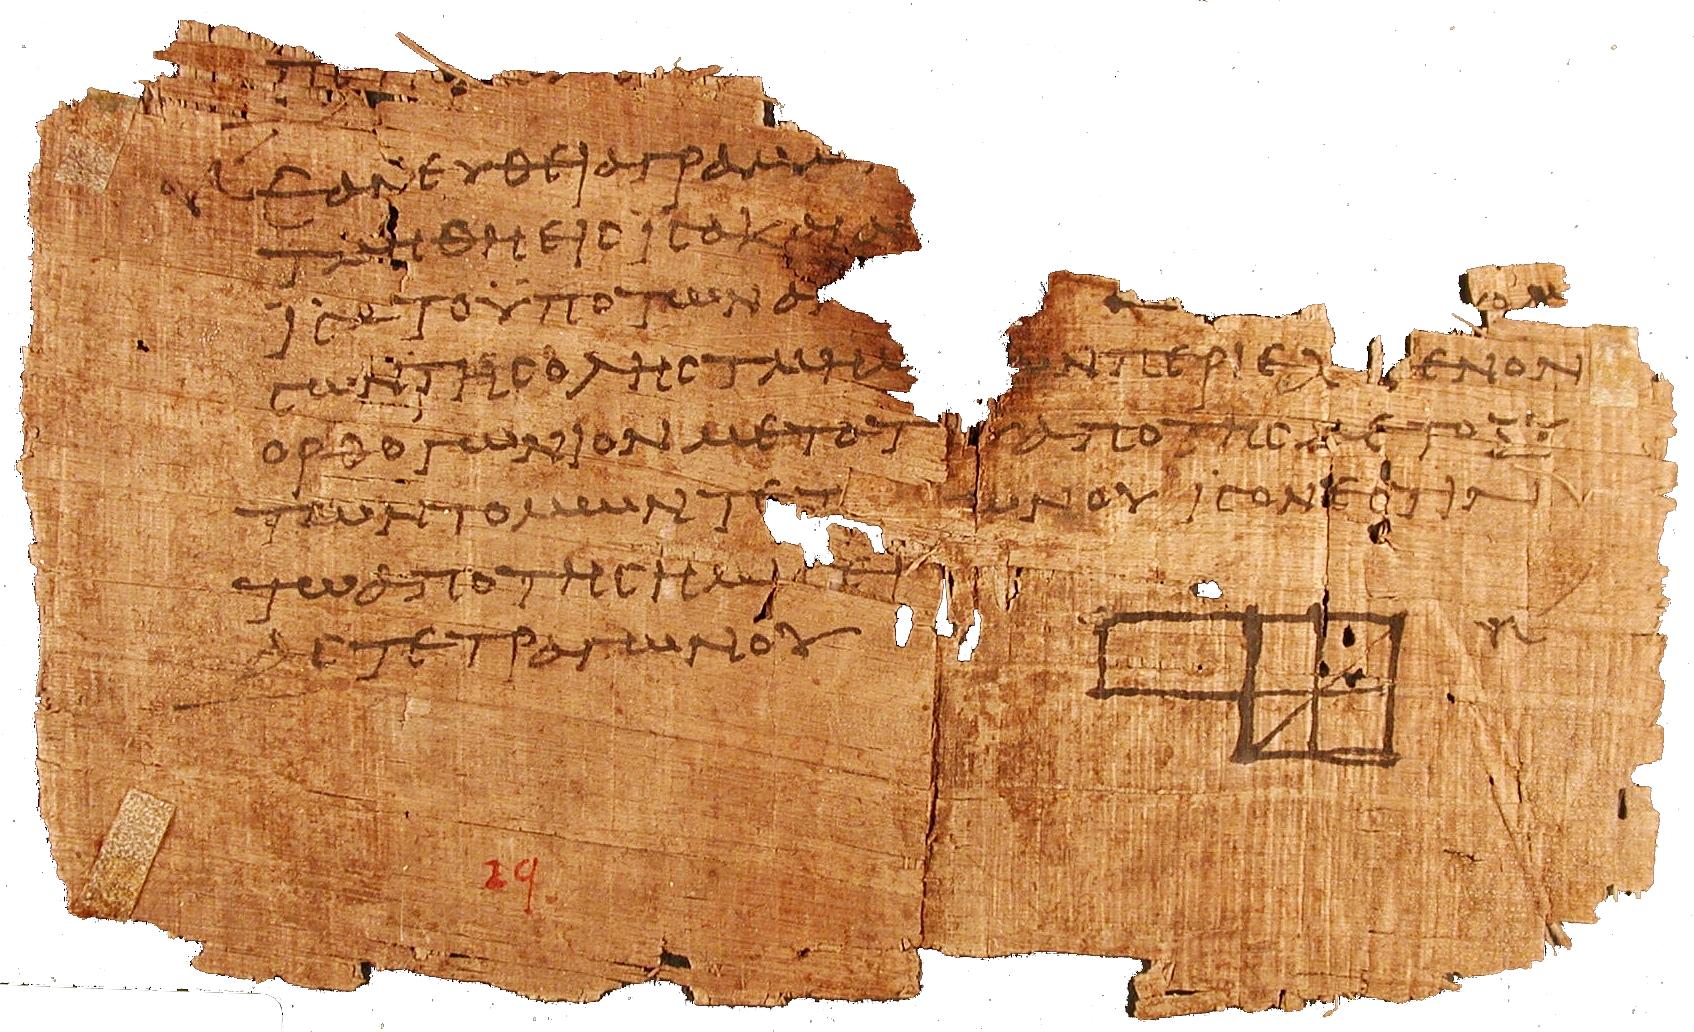

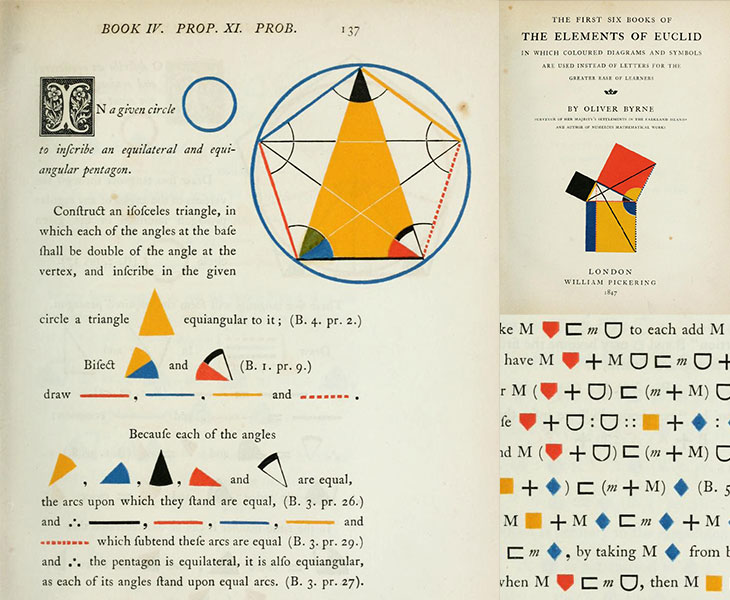
 Since the “parallel postulate” was more complicated than the others, the mathematicians following Euclid would try, for many centuries, to prove it from the four preceding ones, all in vain. In the nineteenth century, there occurred one of the great sudden revolutions in the history of mathematics (and also in human thought, as will be seen by what follows): two new geometries which do not satisfy the fifth postulate, but which are perfectly coherent, were discovered. In one of these geometries, called spherical geometry, no parallel line satisfying the conditions can be traced. This is the case for the surface of a sphere; the straight lines become great circles, whose planes pass through the center of the sphere, and since all great circles intersect each other at two diametrically opposed points (in the manner of the terrestrial meridians, which meet at the poles), no “straight line” can be parallel to another.