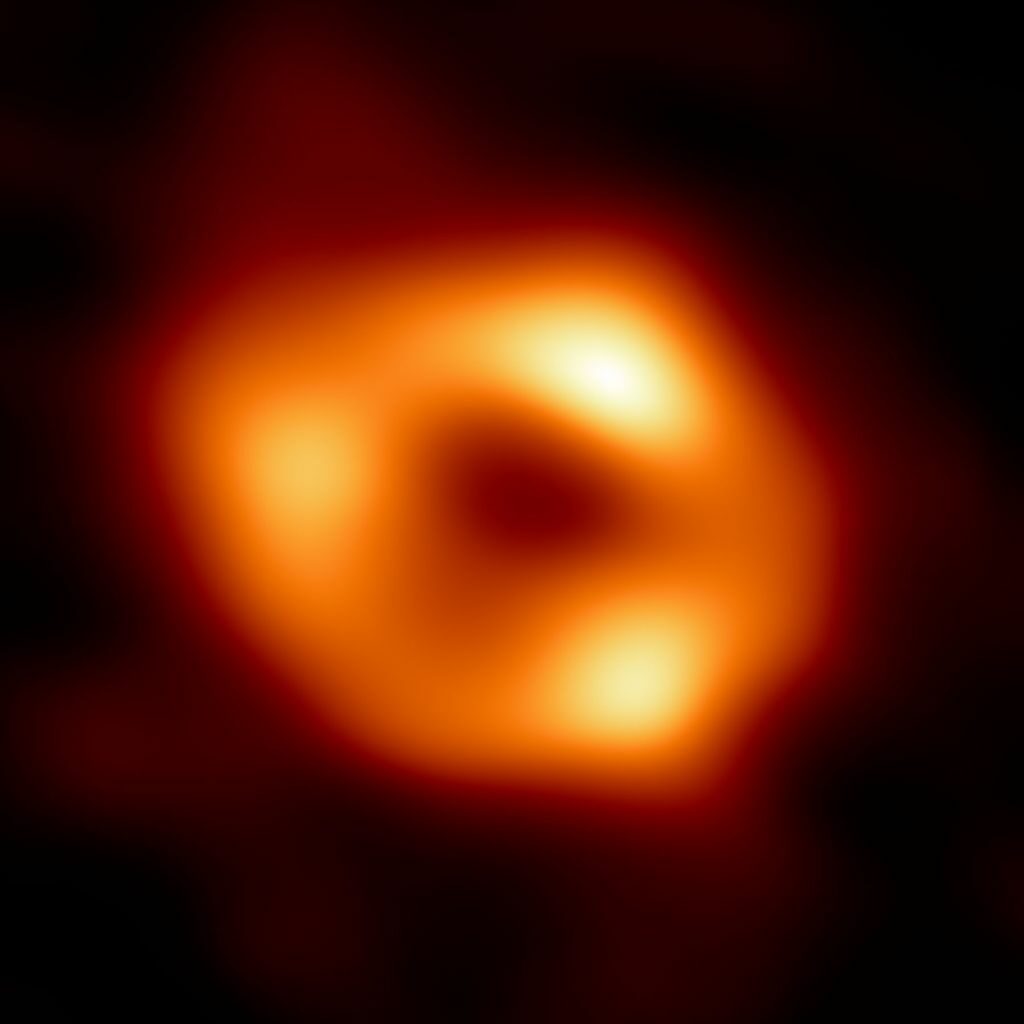
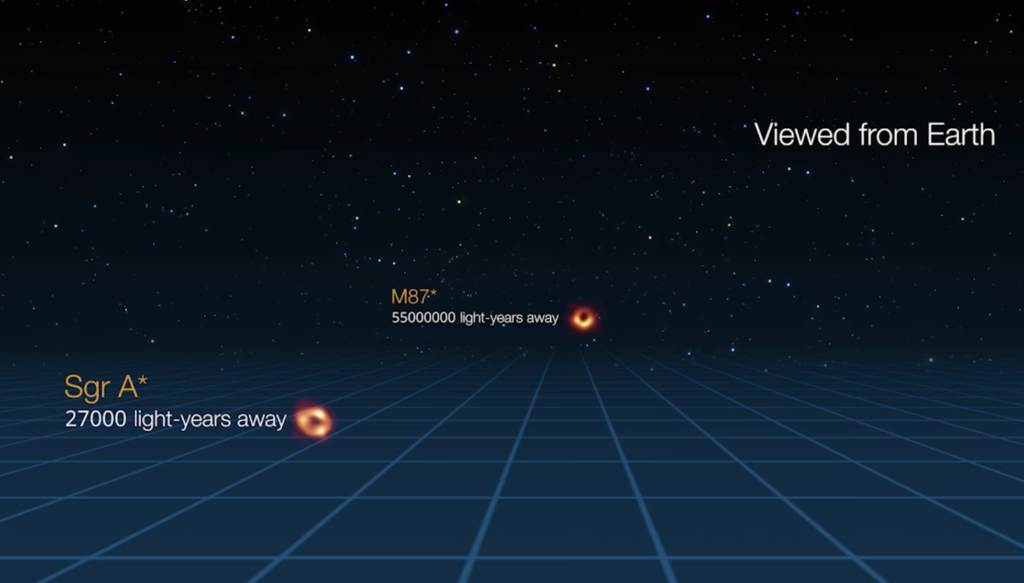
After five years of calculations and analysis, the international collaboration of the Event Horizon Telescope (EHT) delivered on May 12, 2022 the image of Sagittarius A* (Sgr A*), the giant black hole lurking at the center of our galaxy (the Milky Way), 27 000 light-years from Earth. Until now, its presence was only indirectly perceived, from a few radio emissions and the observation of the trajectories of stars orbiting at high speed around a gigantic but invisible mass. After the one obtained by the EHT in 2019 of the gigantic black hole M87* at the heart of the distant elliptical galaxy M87, this is the second direct image of this type of object that we have to date.
A difficult reconstruction
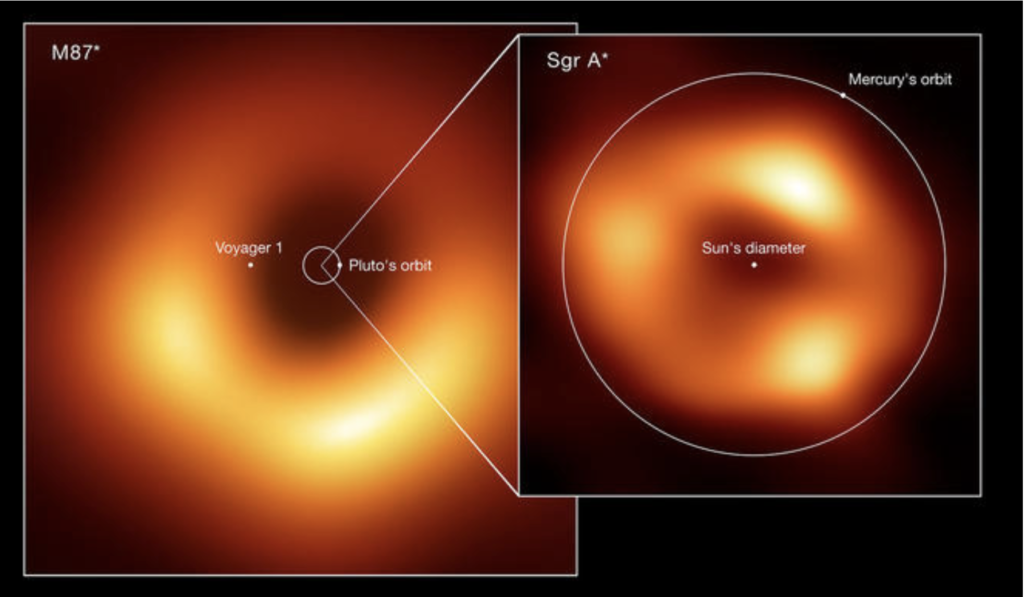
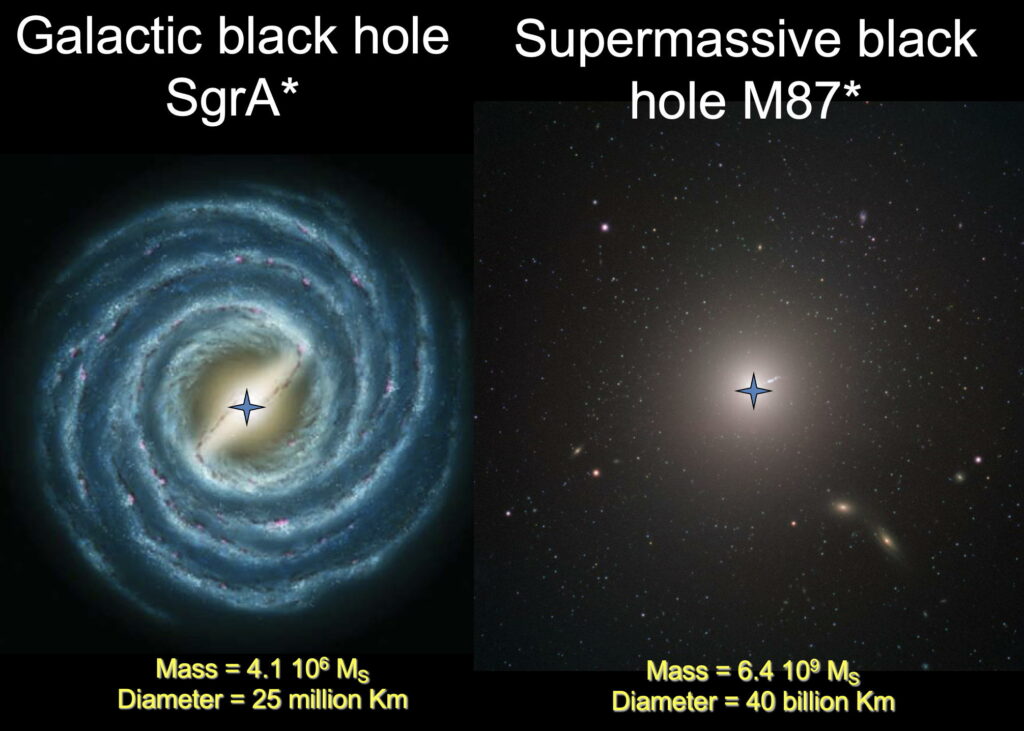
Remember. The very first telescopic image of a black hole surrounded by a disk of hot gas had been unveiled in April 2019 by the same EHT teams: it was the black hole M87* located at the center of the giant elliptical galaxy M87, 50 million light-years away. The observations of Sgr A* had been made in April 2017, during the same campaign as those of M87*. If it took five years of analysis for Sgr A* against two for M87*, it is because during the exposure time of the observations – of the order of an hour –, the light emission of the gas disk around Sgr A* is very variable, whereas that around M87* is almost fixed. The reason is that Sgr A* has a mass 1500 times smaller than M87* (4 million solar masses for SgrA* against 6 billion for M87*), so that the characteristic time scale of the luminous variability, given by the simple formula GM/c^3, is much faster: 20 seconds, against several hours for M87*.
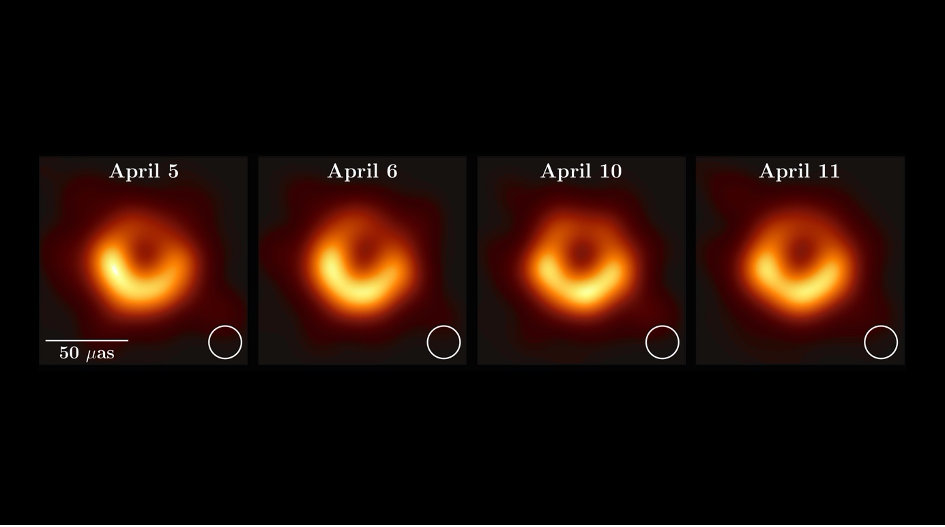
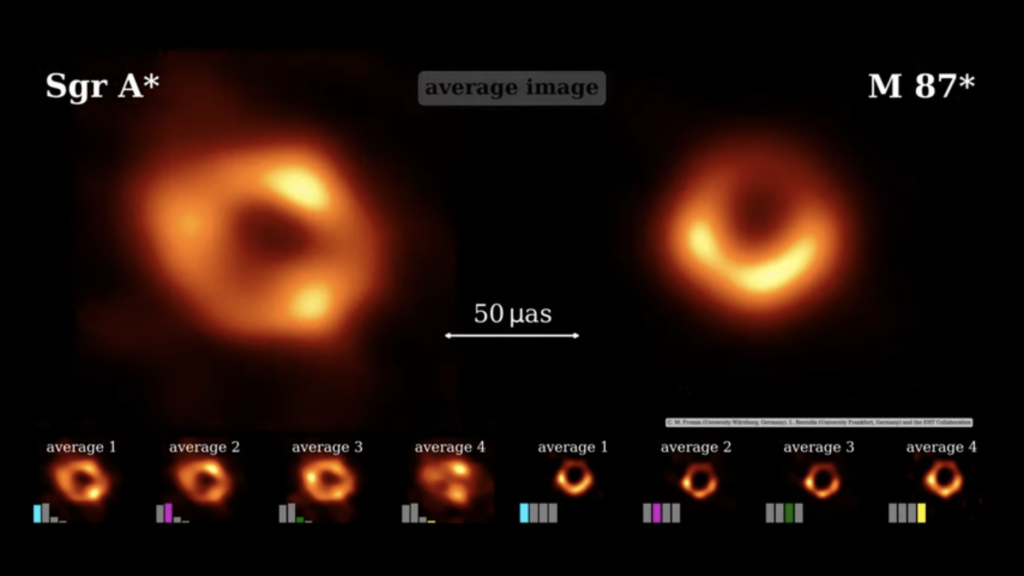
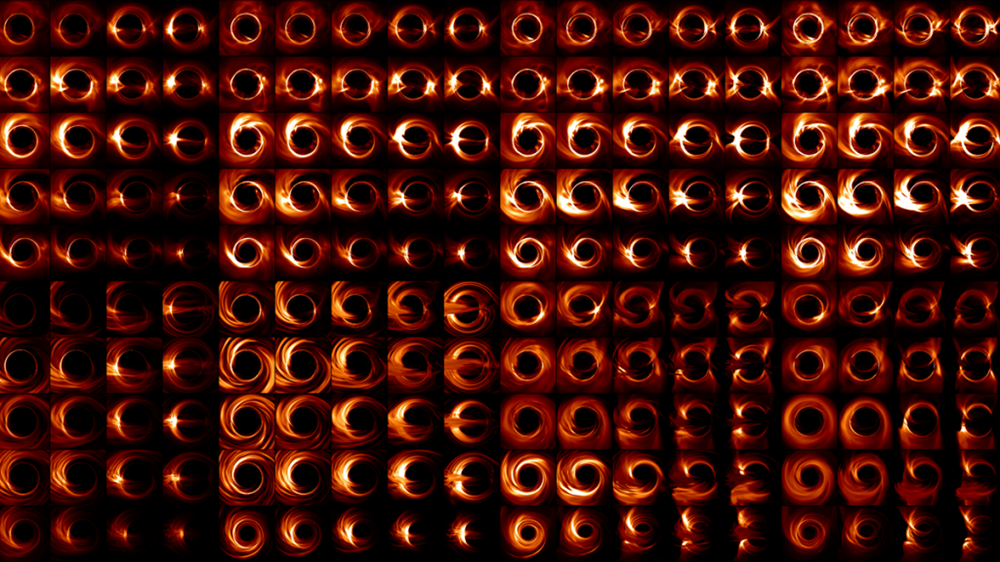
Attempting to capture a sharp image of SgrA* in an exposure time of one hour was therefore like taking a picture of a dog running after its tail. It took considerable integration work to reconstruct a sufficiently sharp “average” image of SgrA*, as Figure 4 clearly shows.
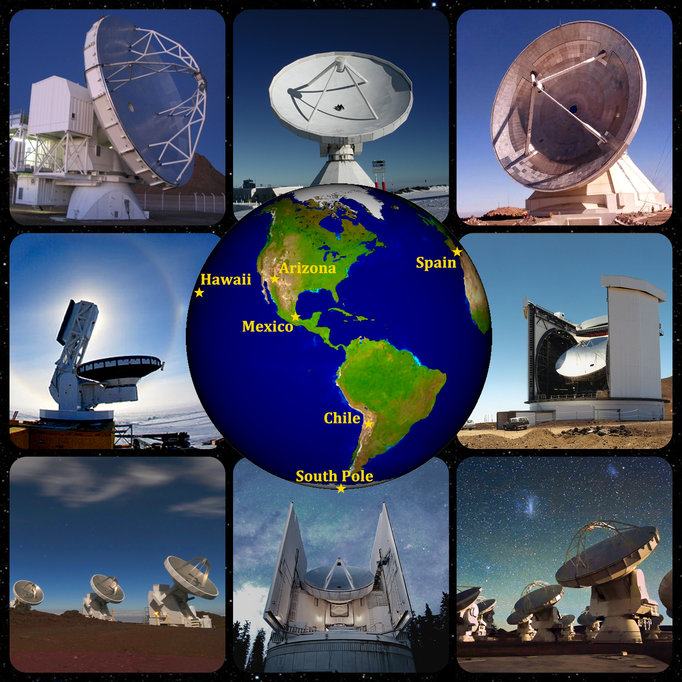
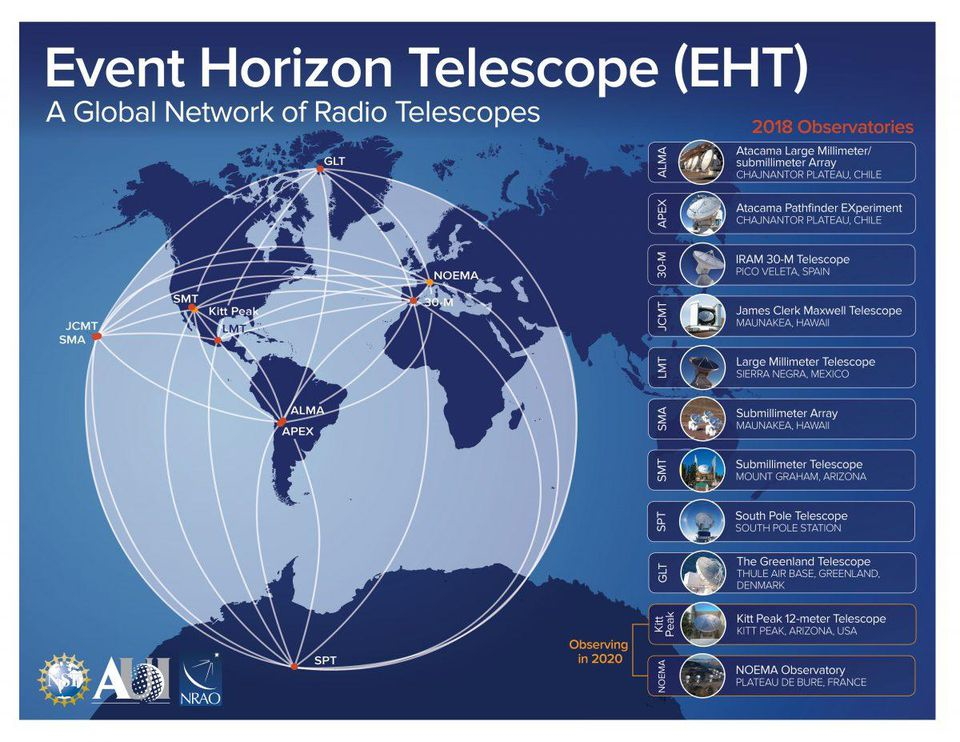
To achieve the angular resolution needed to image SgrA* and M87*, equivalent to the tiny angle at which we would see an apple on the Moon from Earth, the EHT used a network of radiotelescopes stretching from Antarctica to North America via Chile, the Hawaiian Islands, and Europe so as to have the equivalent of a single planet-sized instrument operating in interferometric mode.
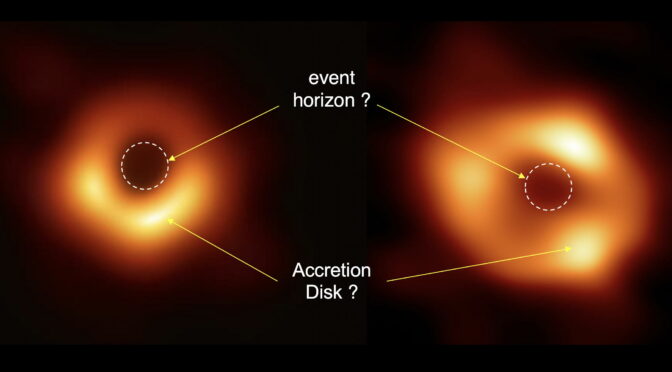
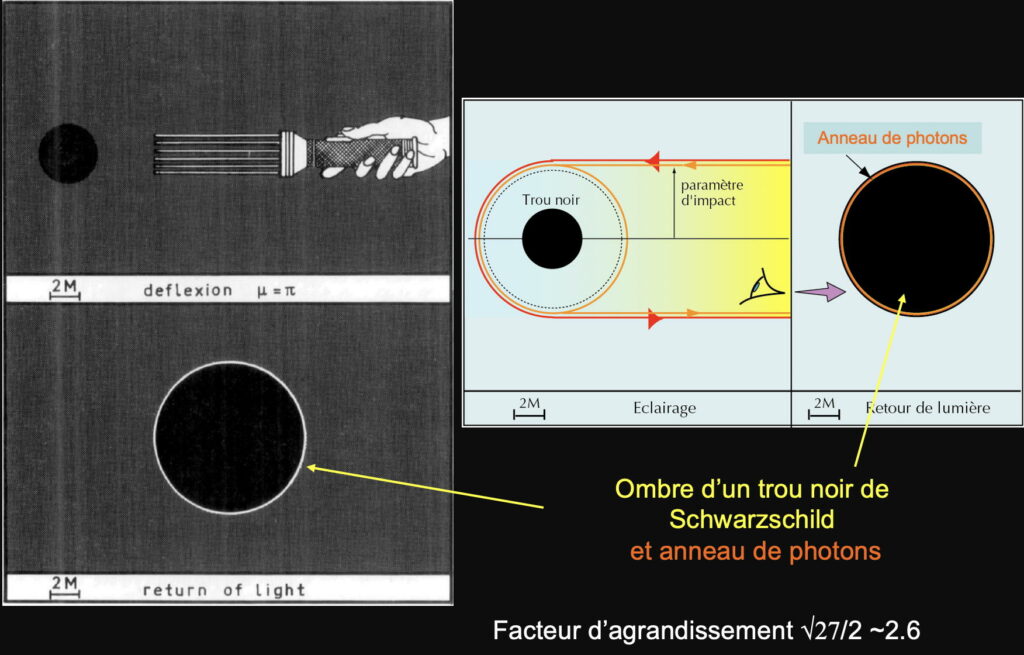
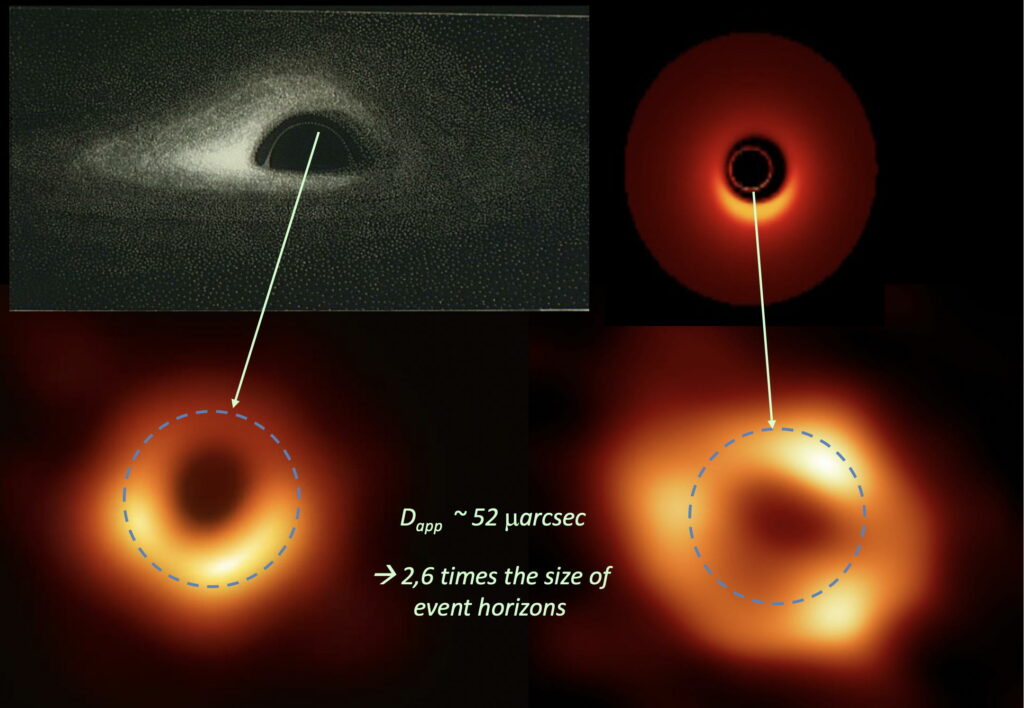
What is striking at first sight is that the two photographs of M87* and SgrA* look very similar: in the center, a black shadow, image of the event horizon (name given, I recall, to the intangible surface of a black hole) enlarged by a factor of 2.6 (as I had shown in my 1979 paper, cf. fig. 6), surrounded by a yellow-orange luminous corona (in false colors), blurred and with spots of highlighting.
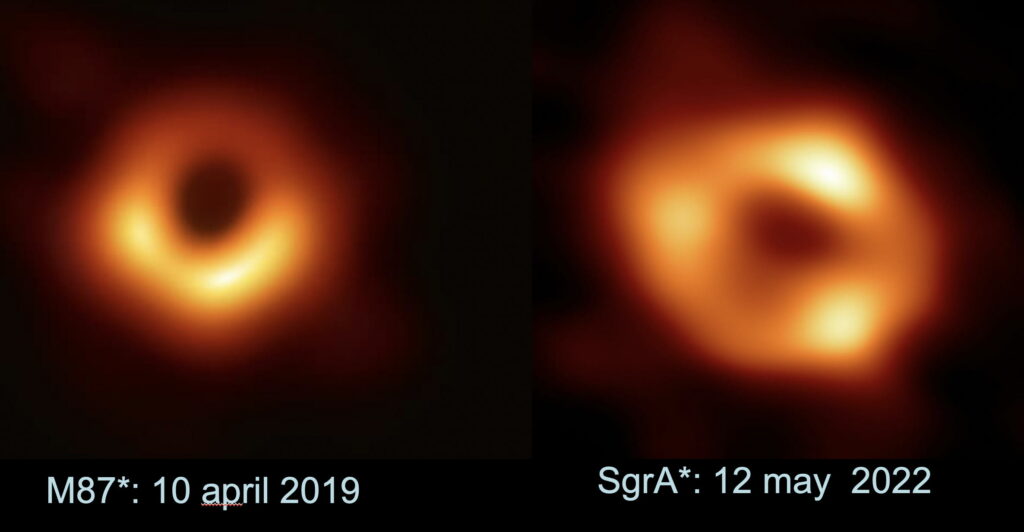
The most important difference is the appearance of three distinct spotlights in the bright ring of SgrA*, whereas the ring of M87 is continuous with two contiguous highlights. Similarly, the central shadow appears less round for SgrA*, probably due to the large number of images that had to be integrated during the hours of observation.
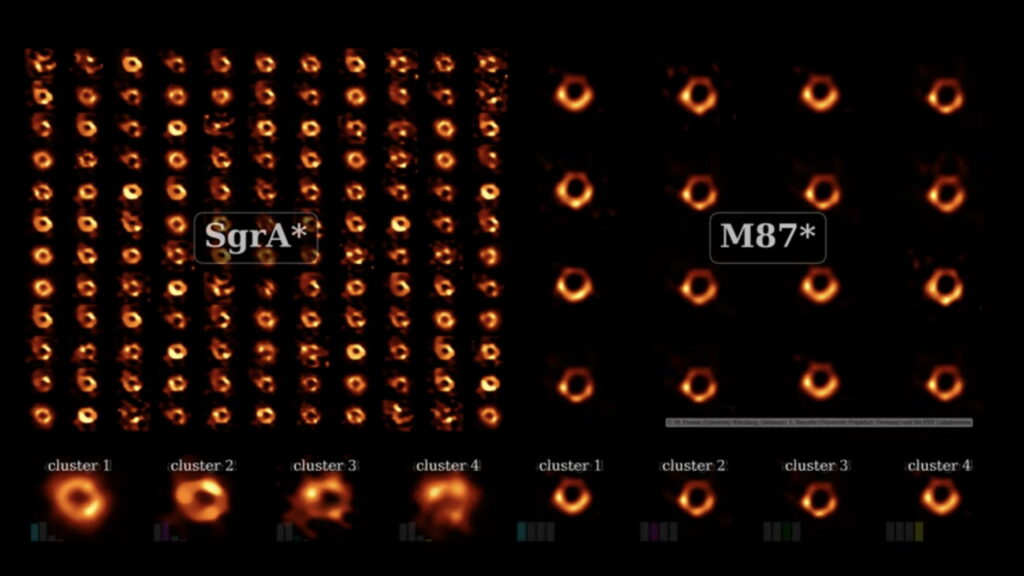
A catalog of several thousands of numerical simulations has been established for comparison with the EHT images and to fix probable ranges of values for the physical characteristics (viewing angle, spin, etc., see below) of SgrA*. Hot ionized gas is rapidly rotating around the black hole, forming spiral arms that become brighter at their tangency with the photon ring, where the light is amplified by strong gravitational lensing. It is these bright points that are integrated in the course of time, and that give the general structure of the luminous rings.
Accretion disk or photon ring?
What exactly do these two historical pictures reveal?
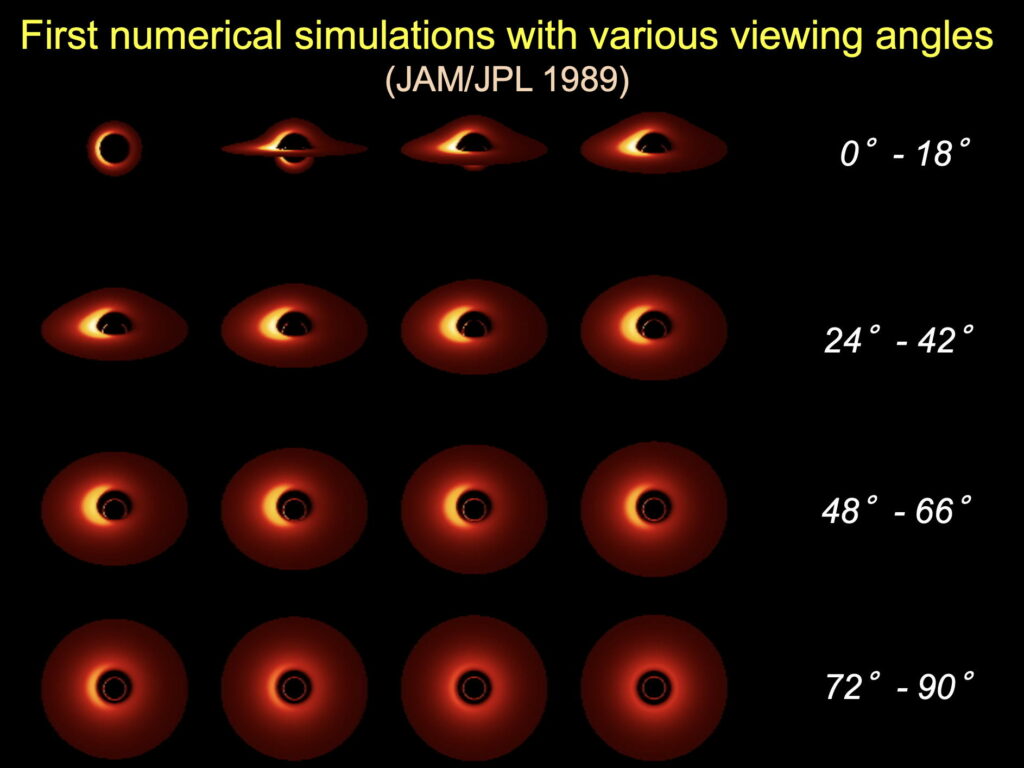
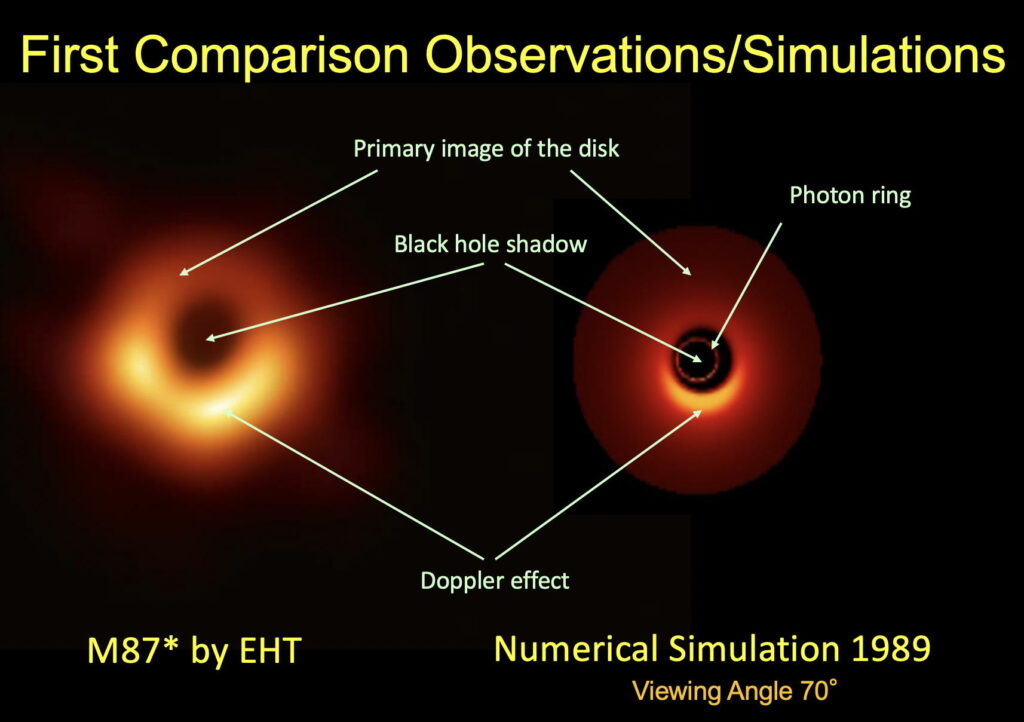
At first sight (a view reserved for a few connoisseurs), one is tempted to compare them with the first numerical simulations performed in 1979 by myself and in 1989 with my collaborator Jean-Alain Marck:
to point out the striking similarities:
and to draw quick conclusions about the structure of the accretion disk and the angle from which it is seen from the Earth:
I confess that I myself got carried away by this interpretation, which on the one hand flattered my pioneering calculations, on the other hand was in no way denied by the EHT researchers, who on the contrary rolled out a red carpet for me at the first conference held on the subject at Harvard University in June 2019.

So much so that, as much for the image of M87* as for the more recent one of SgrA*, this interpretation has been taken up in most of the popular science media. Especially since the specialized articles published by the EHT researchers, full of technical details, remain strangely vague on the question…
However, the physical reality is always more complex than our first reading grids. A finer analysis, made since 2019 on M87* and reinforced in 2022 by that of SgrA*, suggests that the luminous “donut” shaped corona is not the direct image of the gaseous accretion disks orbiting their respective black holes, and that the spotlights do not completely reflect the real state of the gas around the black hole, nor do they translate the Doppler effect due to the relativistic rotation of the gas!
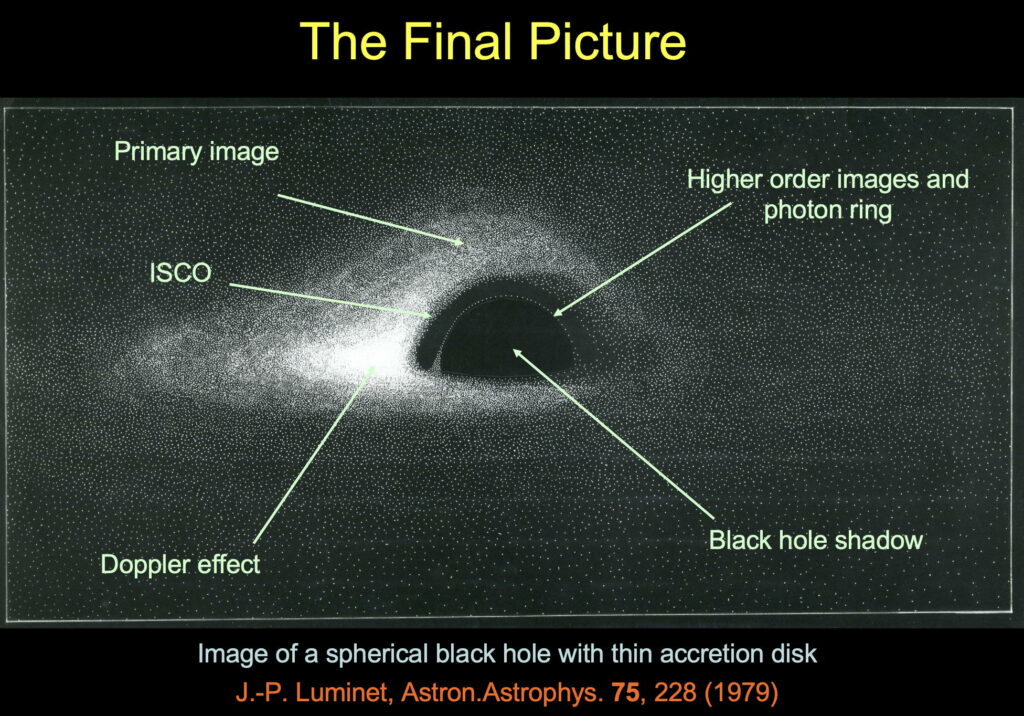
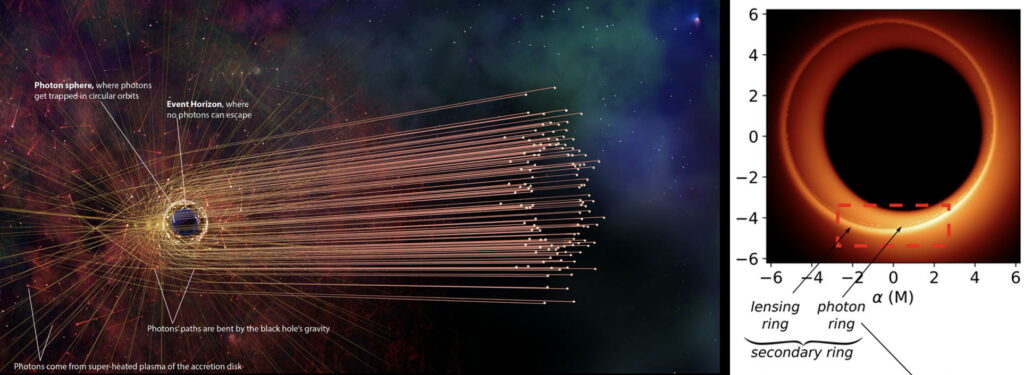
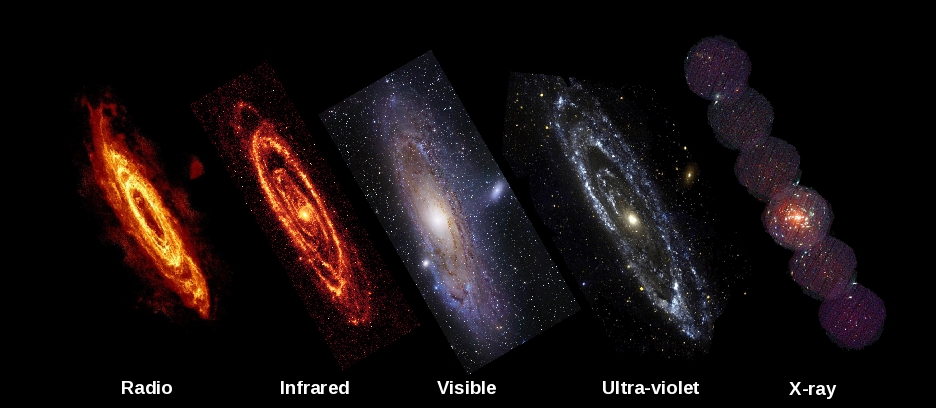
Indeed, the accretion disks around giant black holes radiate essentially in the visible and infrared wavelength domains (around stellar black holes they even radiate essentially in X-rays). However, the EHT observations are not at all bolometric as in our 1979 and 1989 simulations, but are monochromatic, i.e. made in the very precise millimeter wavelength of 1.3 mm. As a result, first, the colors of the EHT images are wrong, coding the intensity of the radiation and not its frequencies (with the same coding that we had already used in 1989). Secondly and more importantly, it turns out that at this wavelength, the most luminous structure is not the primary image of the disk itself, but what is called the “photon ring”, predicted by the theory of general relativity and which I had already calculated in 1979, cf. figure 6 above. It is the bright ring, and normally very thin, formed by the light rays which, between the accretion disk and the observer, have taken orbits highly inflected by the gravity field and completed n/2 turns (n integer > 0) of the black hole before escaping towards the distant observer. The theory predicts in fact a discrete series of rings, indexed by n, but they quickly accumulate one on top of the other as soon as n exceeds 1, defining in the limit (n infinite) a curve called “critical” which exactly encloses the shadow of the black hole.
This is clearly confirmed by the fact that the image of SgrA* gives the size of the ring of light: at a distance of 26,000 light-years, its average apparent diameter of 52 micro-arcseconds corresponds to an intrinsic diameter of 60 million kilometers, or 3.2 light-minutes. This is, to within a few percent, the diameter of the shadow of a black hole of 4.1 million solar masses in rotation, described theoretically by the Kerr solution. This mass, deduced from telescopic observation, is in excellent agreement with the one obtained through the monitoring of stellar trajectories in the vicinity, studied for nearly thirty years by the teams of Reinhard Genzel and Andrea Ghez, who have been awarded the Nobel Prize in Physics in 2020 (see here the blog post that I dedicated to them at the time)

It was the same with the image of M87*: the average apparent diameter of its light ring corresponded to the diameter of the shadow of a black hole of 6 billion solar masses in rotation.
With SgrA* and M87* we thus find, via the Kerr black hole model of general relativity, the confirmations of their central masses deduced from the surrounding stellar dynamics. As the masses of Sgr A* and M87* differ by a factor of a thousand, this is a striking confirmation of the theoretical fact that the properties of black holes are scale invariant.
Characteristics still poorly understood
Contrary to the system of M87* showing clearly jets, which allowed to fix an inclination of 30° between the line of sight from the Earth and the polar axis of the black hole (thus 60° with respect to the plane of the disk), SgrA* does not show jets or no more – probably because the accretion rate has become extremely low compared to past times. As a result, the EHT observations do not give any indication of the inclination of the SgrA* system with respect to the observer (I should point out that there is strictly no reason for the plane of the disk or of the accretion torus of SgrA* to be aligned with the Galactic plane, the two systems with radically different size and mass scales being totally decoupled dynamically). The EHT teams had to perform thousands of magnetohydrodynamic (MHD) simulations, varying the parameters governing the image: inclination angle, angular momentum of the black hole, accretion rate, etc.. It is only by comparing the data reconstructions taken by the EHT with this huge numerical catalog that possible ranges of parameter values can be suggested.
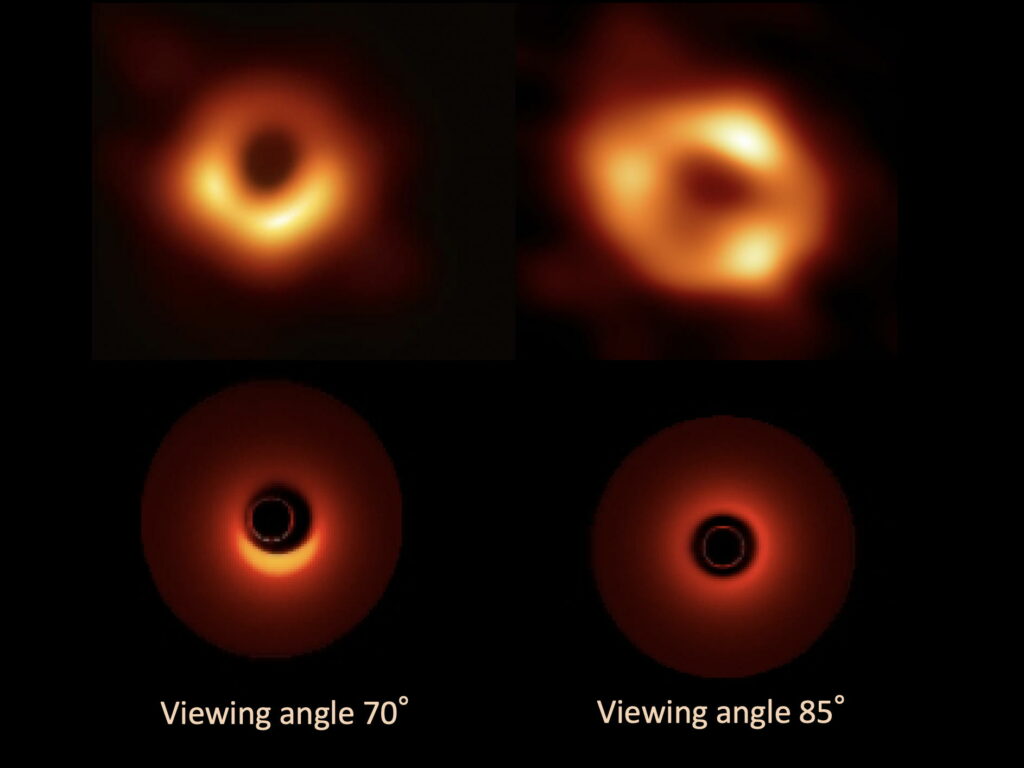
In any case, the best (or least bad) fits for SgrA* are obtained for a tilt angle of 10° with respect to the polar axis, i.e. 80° with respect to the disk plane, and all tilts greater than 50° (i.e. closer to the profile view I published in 1979) are totally excluded. The system is thus probably “almost” seen from the front, not quite but a little more than M87*. At such an angle, the Doppler effect is almost non-existent (the articles do not even mention it), but the comparisons with our 1989 simulations for different angles of view remain relevant.
The same is true for the angular momentum. A rotating black hole, described in general relativity theory by the Kerr metric, is entirely characterized by its mass and its “angular momentum” (also called angular momentum). The latter depends on the size, the mass and the angular velocity of rotation; it cannot exceed a certain critical limit, called “extremal”, above which the event horizon would “burst”. This limit corresponds to a speed of rotation of the horizon equal to the speed of light. To simplify, the angular momentum of a black hole is generally related to its extreme value. The number obtained, called spin, is thus between 0 (zero rotation) and 1 (extremal state).
As for M87*, the spin of Sgr A* could not be measured in the EHT observations. However, the researchers believe that the agreement with their models based on numerical simulations is better for a high spin (greater than 0.5) than for a zero spin – which is a bit surprising since other pre-EHT observations suggested that the spin of SgrA* should not exceed 0.1 (and 0.4 for M87*) A new campaign of EHT observations took place in March 2022, with more radio telescopes integrated in the network; one can thus hope soon (2024?) for a finer image, with perhaps the spin measurement.
In any case, the inferred values for the quasi-polar view angle and the relatively high spin of both SgrA* and M87* allow a better understanding of the aspect of the rings of light that surround the shadow of their respective black holes. Indeed, for a static black hole (Schwarzschild solution), the model used in the first simulations of 1979 and 1989, the inner edge of the accretion disk cannot touch the event horizon of the black hole: the circular orbits followed by the particles are maintained up to a critical distance (ISCO, cf. figure 9) equal to three times the radius of the black hole. But when the spin increases (Kerr black hole), the inner edge gets closer to the horizon, and ends up merging with the ring of light, thus adding its own luminosity.
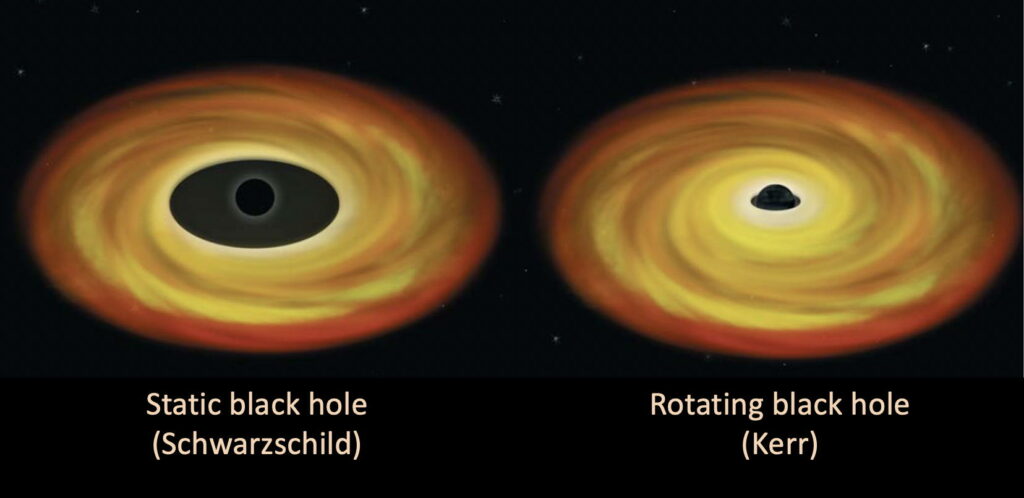
This is indeed what we see on the images of SgrA* and M87* reconstructed by the EHT: their blurred and enlarged luminous rings by lack of resolution result from the superposition between the primary image of the inner edge of the accretion disk and its secondary, tertiary, etc. images constituting the photon ring – dominant at the observation wavelength.
The fact that the flow is dominated by the photon ring also explains the similarity between the two images, whatever the angle of view. The primary image of an accretion disk depends indeed very appreciably on its angle of view (cf. figure 9), which is no longer the case with the photon ring and the images of the disk of order greater than or equal to 2, which always appear circular because of gravitational focusing. I bet that, if in the near future the EHT extended array captures the image of other supermassive black holes under very different angles of view, their images will look like those already obtained for SgrA* and M87*!
Concerning the three bright spots in the ring of SgrA*, about which much has been said, at first sight one would be tempted to interpret them as hot gas bubbles rotating in the inner edge of the accretion disk. Certainly, due to magnetohydrodynamic turbulence, there are bubbles of hot gas that are more luminous than the rest of the accretion structure, but they rotate around the black hole at speeds close to the speed of light and make a complete turn in only a few tens of seconds, so that with the limited temporal resolution of EHT (1 hour, let’s repeat), it is impossible to locate them precisely. The image revealed to the public is therefore only an average of several blurred reconstructions, and the three bright spots along the ring are superposition artifacts rather than the true locations of hot bubbles (curiously, the technical papers are not very clear about this). The technical reason is that the observational data are interferometric, so the image must be reconstructed by a mathematical procedure (called inverse Fourier transform) which, with only 8 radio telescopes, is not unambiguous. The three highlighted areas therefore depend on the reconstruction “methodology” adopted and are not significant of the real state of the gas orbiting SgrA*.
Let us finally mention that comparative tests have also been performed with alternative theories of gravitation, in which there would be no event horizon, and thus no black hole in the strict sense. But all of them fail, which confirms the general relativity model and the Kerr metric around a rotating black hole.
The search for other supermassive black holes
Of the known (candidate) black holes, Sgr A* and M87* are the two largest in apparent size on the plane of the sky, the angular diameter of their shadow being proportional to M/d, where M is the mass of the black hole and d its distance, with M/d very close for Sgr A* and M87*.
After the resounding successes obtained in 2019 with the reconstruction of the telescopic image of the giant black hole M87* and then that of SgrA* in 2022 (Q91), new radio astronomy stations such as the Kitt Peak National Observatory in Arizona, the Greenland Telescope Project in Greenland, and the NOEMA interferometer on the Plateau de Bure in the French Alps, have enlarged the network, which has been rechristened NgEHT (Ng stands for “Next generation”), in order to enhance its performance.
As I mentioned above, a second combined observing campaign took place in March 2022. The black hole that “comes in right behind” M87* and SgrA*, with an apparent size about twice as small, is the supermassive object M31* of about 140 million solar masses, located 2.5 million light-years away in the heart of our big neighbor, the Andromeda galaxy. It is undoubtedly a privileged target for the NgEHT network.
In a more distant future, the interferometric network could be extended to radio telescopes orbiting the Earth, or even installed on the Moon, which would open a new era for the direct telescopic detection of tens of supermassive black holes.
On the other hand, for the tens of known stellar black holes in our galaxy (detected indirectly in binary X-ray sources), their apparent size is 10 000 times smaller, and their shadow will remain forever unobservable by an EHT-type interferometer.