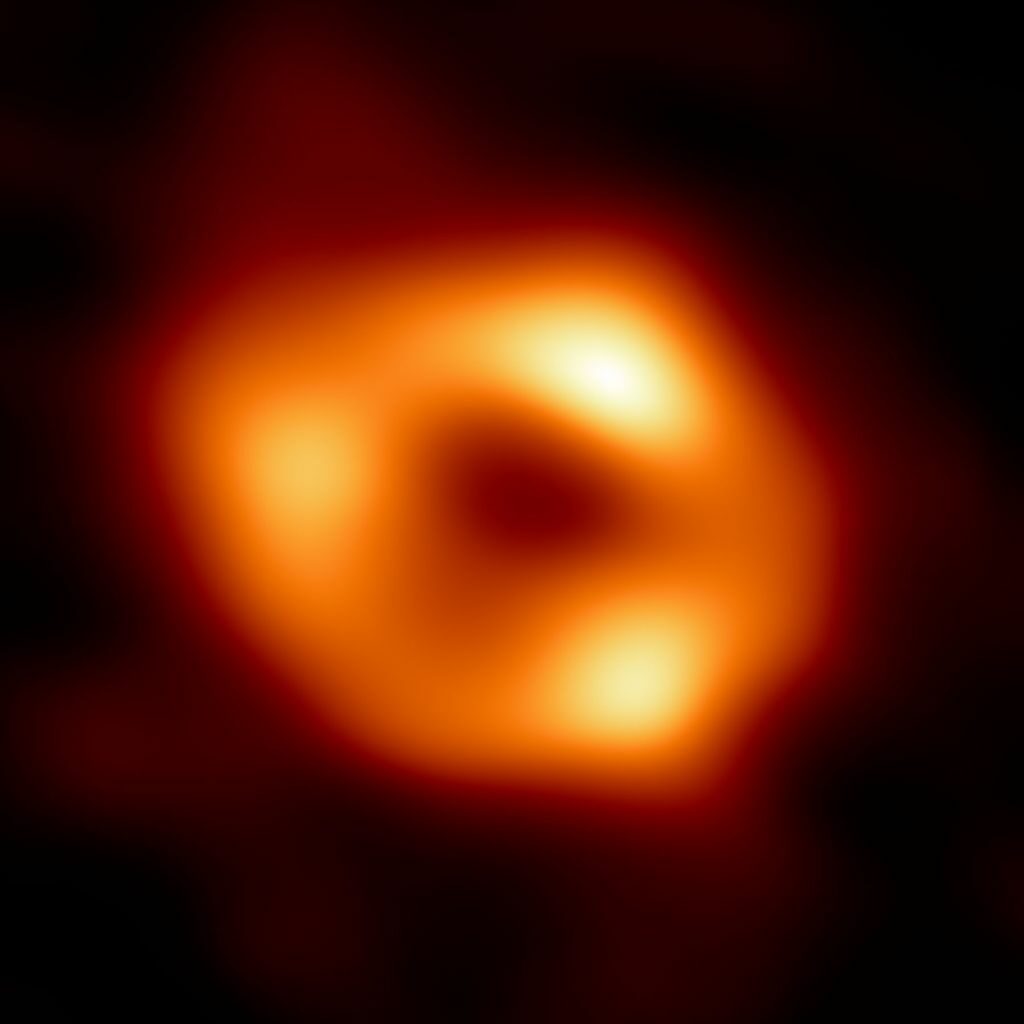
After five years of calculations and analysis, the international collaboration of the Event Horizon Telescope (EHT) delivered on May 12, 2022 the image of Sagittarius A* (Sgr A*), the giant black hole lurking at the center of our galaxy (the Milky Way), 27 000 light-years from Earth. Until now, its presence was only indirectly perceived, from a few radio emissions and the observation of the trajectories of stars orbiting at high speed around a gigantic but invisible mass. After the one obtained by the EHT in 2019 of the gigantic black hole M87* at the heart of the distant elliptical galaxy M87, this is the second direct image of this type of object that we have to date.
A difficult reconstruction
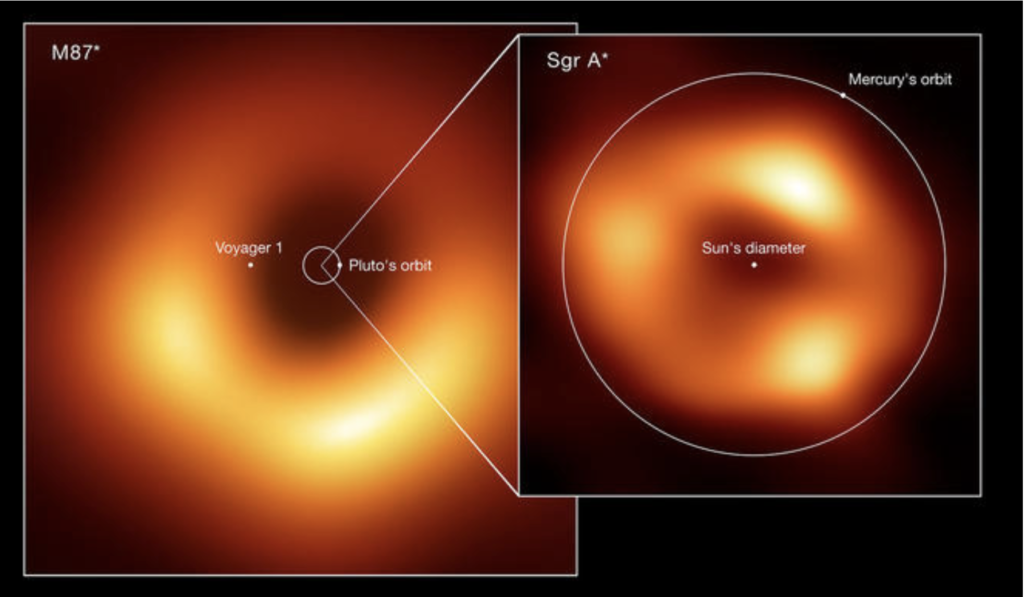
Remember. The very first telescopic image of a black hole surrounded by a disk of hot gas had been unveiled in April 2019 by the same EHT teams: it was the black hole M87* located at the center of the giant elliptical galaxy M87, 50 million light-years away. The observations of Sgr A* had been made in April 2017, during the same campaign as those of M87*. If it took five years of analysis for Sgr A* against two for M87*, it is because during the exposure time of the observations – of the order of an hour –, the light emission of the gas disk around Sgr A* is very variable, whereas that around M87* is almost fixed. The reason is that Sgr A* has a mass 1500 times smaller than M87* (4 million solar masses for SgrA* against 6 billion for M87*), so that the characteristic time scale of the luminous variability, given by the simple formula GM/c^3, is much faster: 20 seconds, against several hours for M87*.
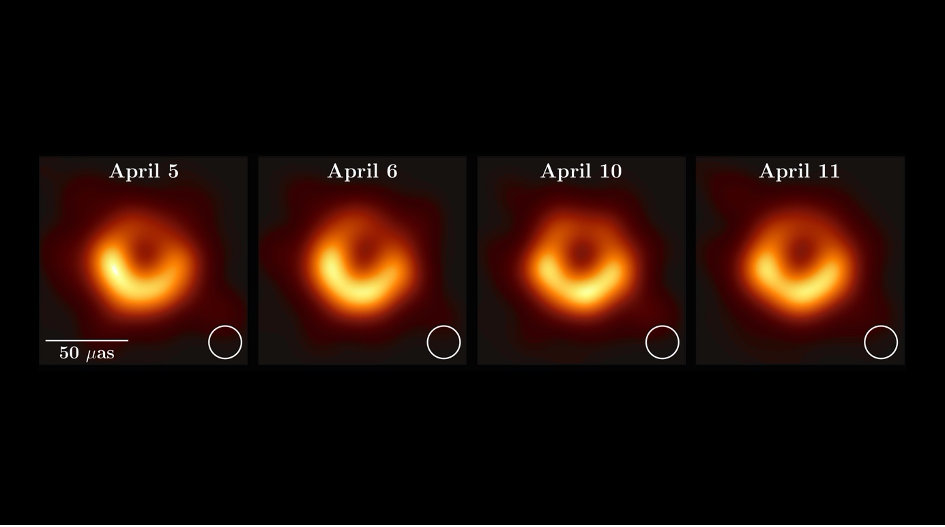
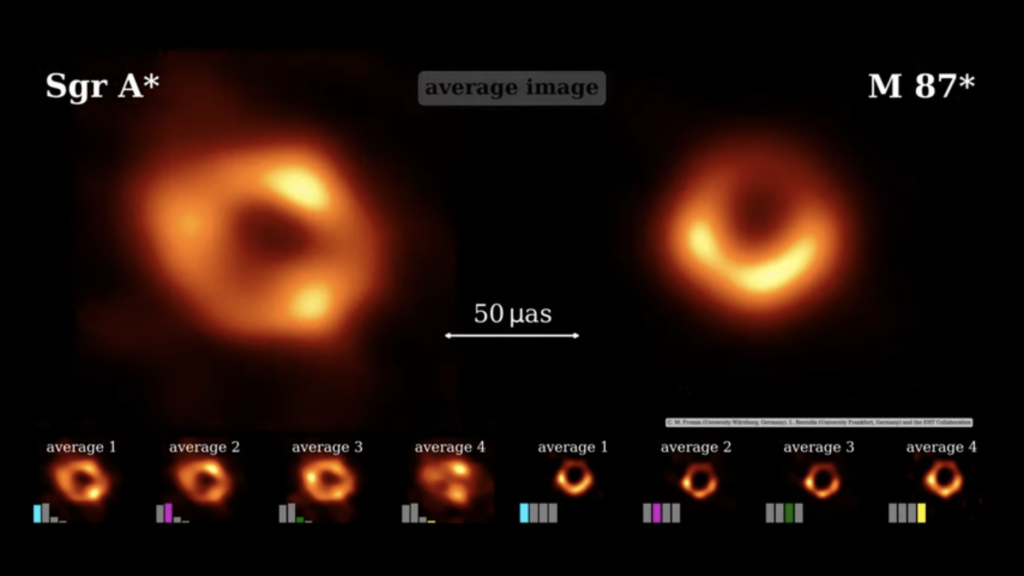
Attempting to capture a sharp image of SgrA* in an exposure time of one hour was therefore like taking a picture of a dog running after its tail. It took considerable integration work to reconstruct a sufficiently sharp “average” image of SgrA*, as Figure 4 clearly shows.
To achieve the angular resolution needed to image SgrA* and M87*, equivalent to the tiny angle at which we would see an apple on the Moon from Earth, the EHT used a network of radiotelescopes stretching from Antarctica to North America via Chile, the Hawaiian Islands, and Europe so as to have the equivalent of a single planet-sized instrument operating in interferometric mode.

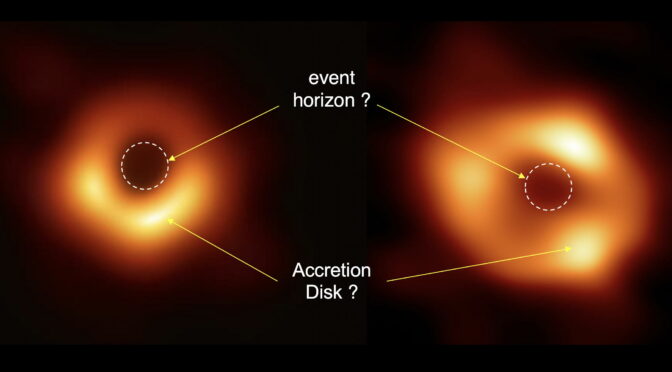
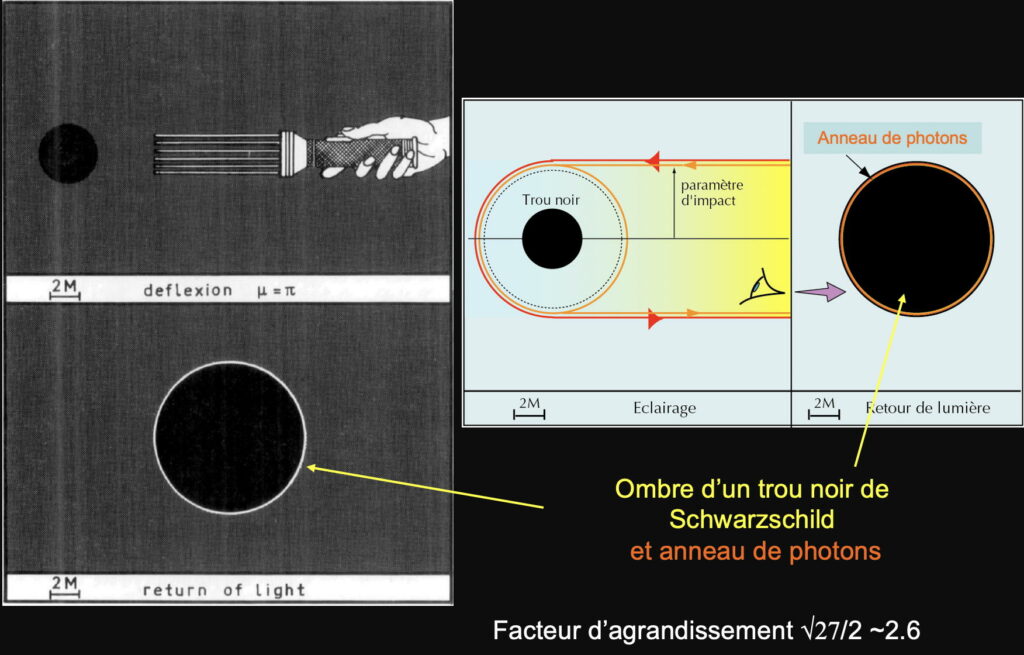
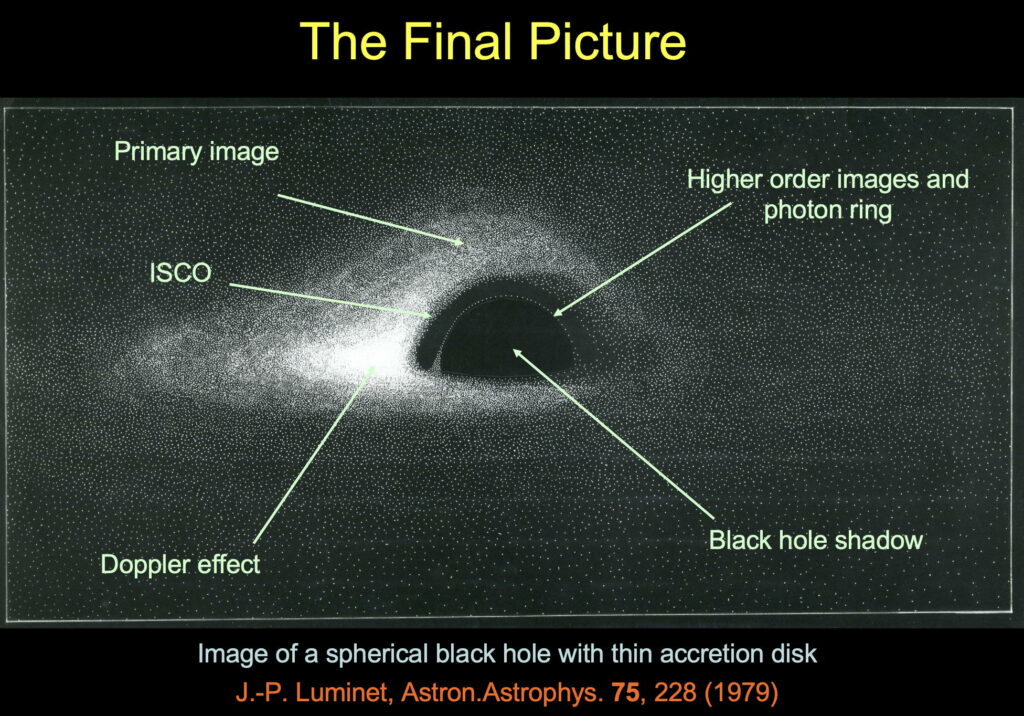
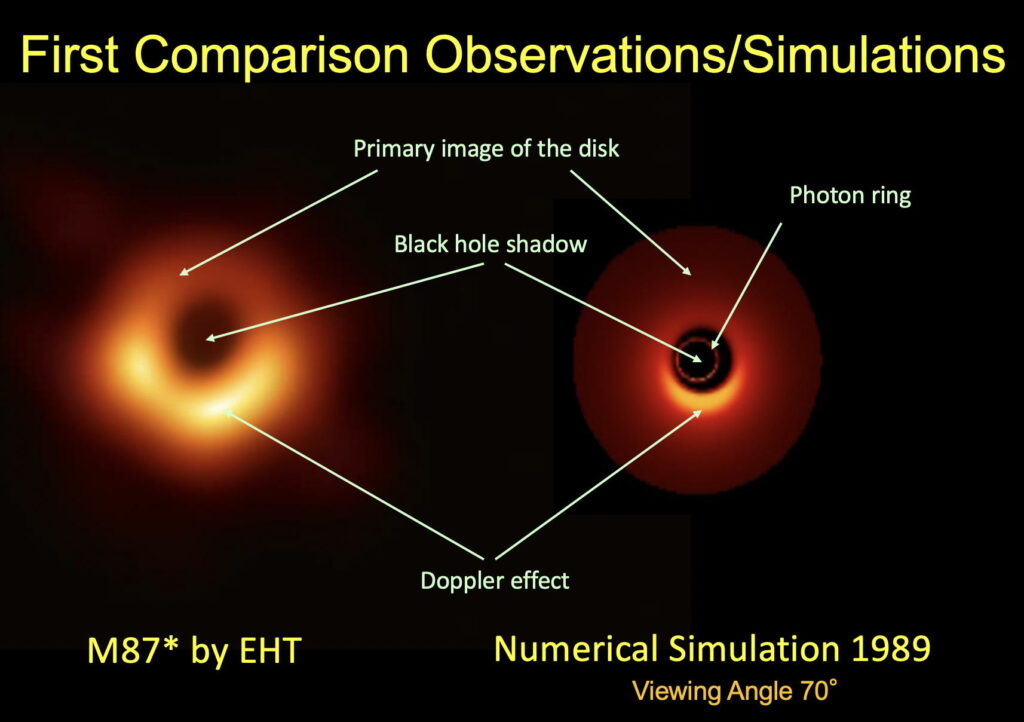
What is striking at first sight is that the two photographs of M87* and SgrA* look very similar: in the center, a black shadow, image of the event horizon (name given, I recall, to the intangible surface of a black hole) enlarged by a factor of 2.6 (as I had shown in my 1979 paper, cf. fig. 6), surrounded by a yellow-orange luminous corona (in false colors), blurred and with spots of highlighting.
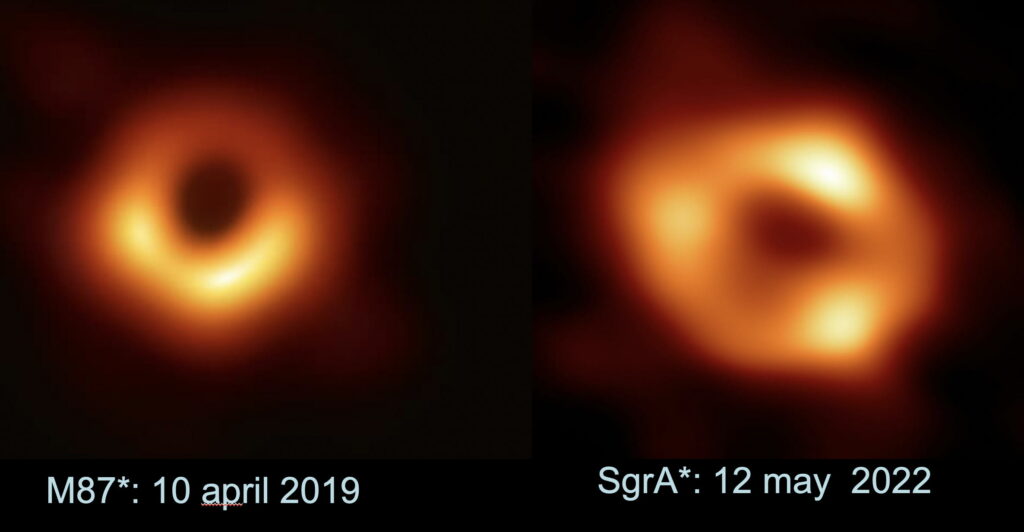
The most important difference is the appearance of three distinct spotlights in the bright ring of SgrA*, whereas the ring of M87 is continuous with two contiguous highlights. Similarly, the central shadow appears less round for SgrA*, probably due to the large number of images that had to be integrated during the hours of observation.
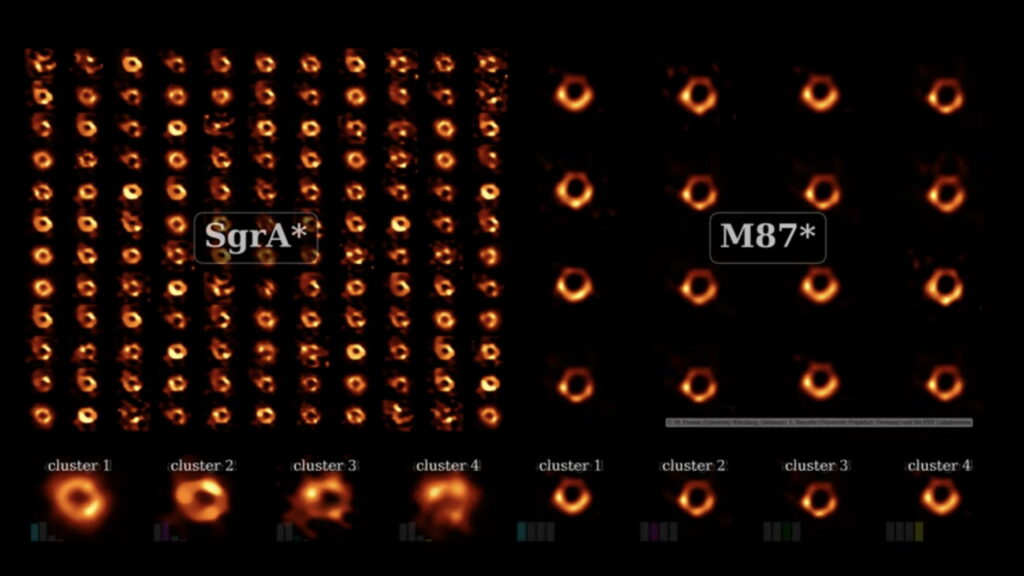
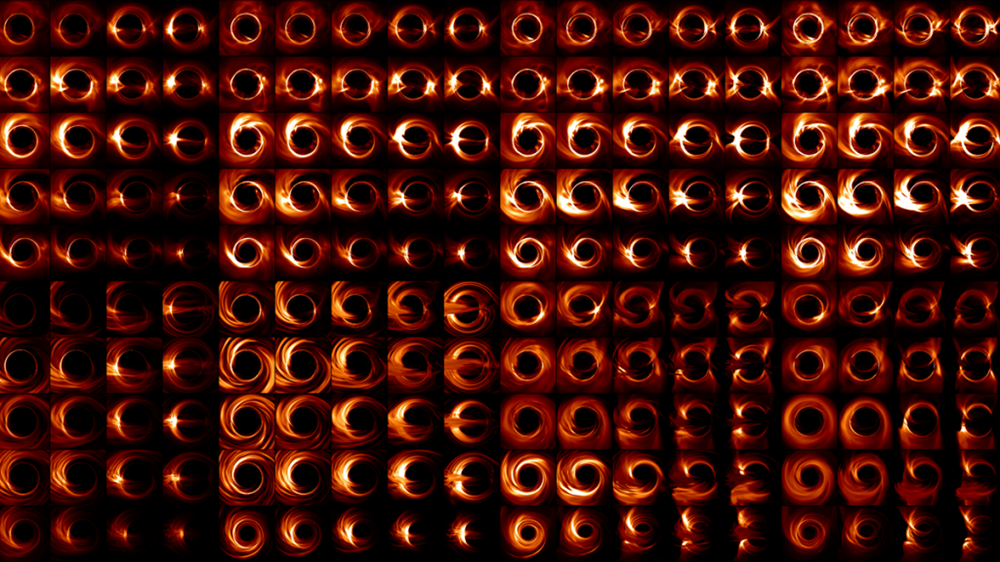
A catalog of several thousands of numerical simulations has been established for comparison with the EHT images and to fix probable ranges of values for the physical characteristics (viewing angle, spin, etc., see below) of SgrA*. Hot ionized gas is rapidly rotating around the black hole, forming spiral arms that become brighter at their tangency with the photon ring, where the light is amplified by strong gravitational lensing. It is these bright points that are integrated in the course of time, and that give the general structure of the luminous rings.
Accretion disk or photon ring?
What exactly do these two historical pictures reveal?
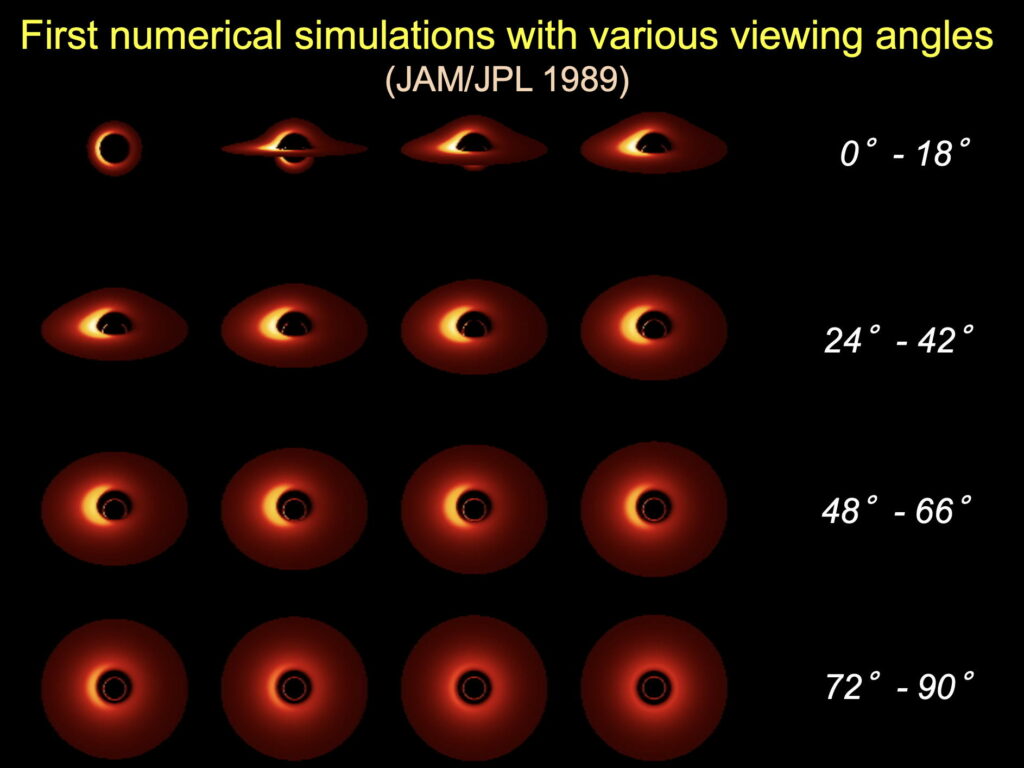
At first sight (a view reserved for a few connoisseurs), one is tempted to compare them with the first numerical simulations performed in 1979 by myself and in 1989 with my collaborator Jean-Alain Marck:
to point out the striking similarities:
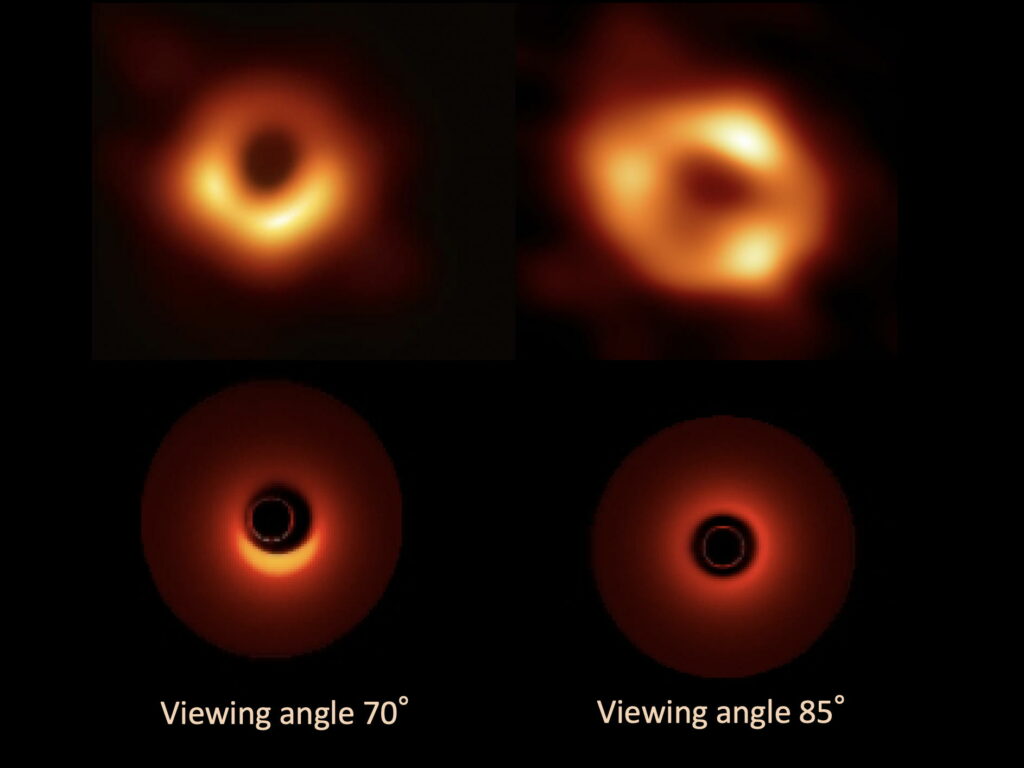
and to draw quick conclusions about the structure of the accretion disk and the angle from which it is seen from the Earth:
I confess that I myself got carried away by this interpretation, which on the one hand flattered my pioneering calculations, on the other hand was in no way denied by the EHT researchers, who on the contrary rolled out a red carpet for me at the first conference held on the subject at Harvard University in June 2019.

So much so that, as much for the image of M87* as for the more recent one of SgrA*, this interpretation has been taken up in most of the popular science media. Especially since the specialized articles published by the EHT researchers, full of technical details, remain strangely vague on the question…
However, the physical reality is always more complex than our first reading grids. A finer analysis, made since 2019 on M87* and reinforced in 2022 by that of SgrA*, suggests that the luminous “donut” shaped corona is not the direct image of the gaseous accretion disks orbiting their respective black holes, and that the spotlights do not completely reflect the real state of the gas around the black hole, nor do they translate the Doppler effect due to the relativistic rotation of the gas! Continue reading First image of the galactic black hole Sagittarius A*: an unprecedented decryption